EngageNY
Summarizing a Data Distribution by Describing Center, Variability, and Shape
Put those numbers to work by completing a statistical study! Pupils finish the last two steps in a statistical study by summarizing data with displays and numerical summaries. Individuals use the summaries to answer the statistical...
Curated OER
Shorten the Length
Learn how to summarize by identifying main ideas and supporting details. Readers cross out unimportant information as they read through a text. Is it a random detail? Cross it out! They then draw a concept map, placing the main idea in...
EngageNY
Summarizing Bivariate Categorical Data in a Two-Way Table
Be sure to look both ways when making a two-way table. In the lesson, scholars learn to create two-way tables to display bivariate data. They calculate relative frequencies to answer questions of interest in the 14th part of the series.
Curated OER
Adding & Subtracting (Combining) Integers
Maintain a positive atmosphere in your math class with this fun lesson on adding and subtracting integers. After first explaining the rules for combining positive and negative numbers, this resource uses a comic strip...
EngageNY
Calculating Probabilities of Events Using Two-Way Tables
Tables are useful for more than just eating. Learners use tables to organize data and calculate probabilities and conditional probabilities.
EngageNY
Drawing a Conclusion from an Experiment (part 2)
Communicating results is just as important as getting results! Learners create a poster to highlight their findings in the experiment conducted in the previous lesson in a 30-part series. The resource provides specific criteria and...
Mathed Up!
Two Way Tables
When presented with categorical data, a two-way frequency table is a great way to summarize the information. Pupils organize categorical data using a two-way table, then use the tables to determine missing data and to calculate simple...
Curated OER
How Many People Live in Your Household?
Students create a pictograph showing household size for the class.In this data collection and graphing lesson, the teacher guides students through the creation of a concrete object graph, then students analyze and summarize the results.
EngageNY
Graphs of Linear Functions and Rate of Change
Discover an important property of linear functions. Learners use the slope formula to calculate the rates of change of linear functions. They find that linear functions have constant rates of change and use this property to determine if...
Mathed Up!
Area of Sector and Length of Arcs
Viewers learn how to apply proportional reasoning to find area of sectors and arc lengths with a video that starts off explaining how to find the areas of circle sectors and the lengths of arcs. Scholars then practice solving problems...
Mathed Up!
Transformation of Graphs
In what ways can you transform a graph? An engaging video answers this question as it covers reflections, translations, and stretches of graphs. To test their knowledge, individuals complete a set of problems to apply this knowledge.
Curated OER
Lift Equation Problem Set
Students, after reading an explanation from a NASA Web-based textbook, demonstrate an understanding of the text by using it, along with FoilSim, to complete an activity to graph and interpret the lift equation.
Curated OER
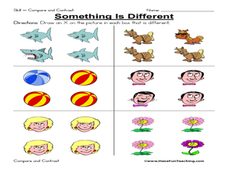
Something is Different: Same/Different
In this different/same worksheet, student draw an X on the picture in a box that is different from the others, 6 sets total. A reference web site is given for additional activities.
EngageNY
Equivalent Ratios II
What is the connection between equivalent ratios? Class members first find the multiplication factor used to create equivalent ratios. Next, they take that information to determine whether ratios are equivalent. The second lesson on...
Curated OER
Disc/Washer Method
Young scholars calculate the volume of solids. In this calculus lesson, students apply the Disk and Washer Method to solve for the volume of three dimensional objects. They calculate the volume caused by rotation that...
Curated OER
Exploring Quadratic Graphs
Students solve quadratic equations using graphs. In this algebra lesson, students factor quadratic equations and graph their answer. They discuss the shape of their graph based on the function.
Curated OER
Systems of Equations
Pupils solve inequalities and systems of equations. For this algebra lesson, students use substitution and elimination as they solve algebraic systems. They use graphing and a table to support their solutions.
Curated OER
Two Digit Subtraction
Second graders identify two digit numbers and work with two digit subtraction problems. They use manipulatives to demonstrate each problem.
Curated OER
Composition of Functions
High schoolers solve problems using the composition of functions. In this algebra lesson, students analyze the graph of a quadratic equation for its vertex and intercepts. they find the inverse of the function using addition,...
Curated OER
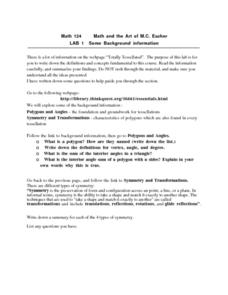
Math Lab
In this polygons and angles learning exercise, 10th graders complete 5 different questions related to polygons and angles, in addition to symmetry and transformations. First, they define polygon and how they are named. Then, students...
Curated OER
Lines and Angles
Sixth graders explore lines and angles. They create visual representations of lines, rays and angles by drawing them on paper and using a geoboard. On paper, 6th graders write a summary of the characteristics of their representations.
Curated OER
Using 3-D Models for Code Validation with FoilSim
High schoolers use FoilSim to complete the activity to create tables of data sets comparing the lift values for a 3-D model of a symmetrical wing section to the values predicted by the FoilSim software.
Curated OER
A Unified China
Students examine the major changes Qin accomplished as emperor. They look at his steps to unify China, create a money standard, measurement standards, and a system of bureaucracy.
Curated OER
Relative Size: Big and Little
Students work with big and little objects by placing objects in order small to large, and by completing a worksheet.


