Curated OER
What is a Box and Whisker Plot?
Eighth graders explore the correct use of box and whisker plors. The times when they are appropriate to use to compare data is covered. They plot data according to statistical analysis including mean, median, and mode.
Curated OER
Burger King Investigation
Students study data on the nutritional value of Burger King meals in order to discover its nutritional value and also to compare the meals, using mathematical computation, to the recommended daily diet. In this data handling...
Curated OER
Lesson 9: Tracking Commodities
Over the corse of a month, small groups will monitor the price of a specific energy commodity and analyze it in relation to global and domestic events. They play a trade simulation game and create infographics showing what they've...
American Chemical Society
Evaporation
This is one in several lessons that explore the relationship between temperature and phase changes of water. After some discussion, elementary physical scientists place wet paper toweling on a hot and a room-temperature water bag...
Curated OER
Handling Data: Probability, Chase Me game
Learners participate in a simulation in which the aim is for the tortoise to catch up with the hare or vice versa. Moves are decided by throwing two dice. Adding together the numbers on the two dice tells you which animal moves one...
Curated OER
It Has Been Rubbish For Years
Students are presented with the problems of percentages and focus upon numbers in contrast to 100. They calculate problems with money and are engaged with the use of games as a teaching tool. Students also interpret data as presented in...
University of Georgia
Heating and Cooling of Land Forms
Compare heating and cooling rates of different land forms. A lab activity has groups collect data on the rate of heating and cooling of soil, grass, saltwater, fresh water, and sand. An analysis of the rates shows how the different land...
Curated OER
Tourism in London
Students discuss the tourist attractions that are in London. They examine how data can be manipulated by completing a worksheet. They plan a trip to a London attraction after conducting Internet research.
Curated OER
The Shape of Things
Sixth graders read and discuss information regarding the shape and attributes of an eggshell. In this shape of things lesson, 6th graders gather relevant information that pertains to the incubation and formation of an eggshell. ...
Curated OER
Safety Comes First
Here is a thorough lesson on safety in the chemistry lab. Chemists review a detailed list of safety rules, draw the layout of the laboratory area to include emergency equipment, identify hazard warnings, and consult the MSDS in order to...
Curated OER
Bird Airport Control
Students visit a local wetland and record observations of waterfowl on downloadable worksheets. They compile class data and list similarities and differences among species of birds observed.
Curated OER
Dissecting Owl Pellets
Students watch the teacher model the dissection then in pairs, they dissect an owl pellet and identify its contents. They record the data about its prey on a graph.
Nuffield Foundation
Measuring the Rate of Metabolism
Plant respiration can be a difficult concept for young biologists to grasp; with a hands-on lab, learners can collect and graph data, then calculate the metabolism rate for the plants they studied. If you do not have a respirometer,...
Curated OER
Handling Data: Comparing Distributions
Pupils gather information by analyzing graphs, diagrams and pie charts. In this graphs and diagrams lesson, students complete addition and subtraction problems. Pupils discuss a pie chart. Students use information to crate a stacked bar...
Curated OER
Handling Data: Probability
Fourth graders find and justify probabilities and approximations. In this repeating experiment, 4th graders complete a worksheet after rolling die and tossing coins to determine outcomes.
NASA
Discovering Some of Your “Yardsticks” Are Actually “Meter-sticks”
The Milky Way gets great reviews on Trip Advisor — 100 million stars. The activity allows scholars to rethink their assumptions and prior knowledge. Pupils observe a set of two lights at equal distance and brightness, but they believe...
Curated OER
Bisphenol A and Diabetes
Pupils summarize the data that is displayed and examine how bisphenol A behaves and how it contributes to diabetes. Learners also study an article and interpret line graphs.
Curated OER
Color Mixing
Students experiment with primary colored water to mix new colors. They record new colors on a simple data sheet and share opinions on their work.
Curated OER
Investigating Mitosis in Allium Root Tip Squash
Preparing the root tip samples is the most challenging part of the mitosis-viewing lab found here, but the directions help ensure you have everything you need. There is no worksheet included; however, there is a sample data table....
Curated OER
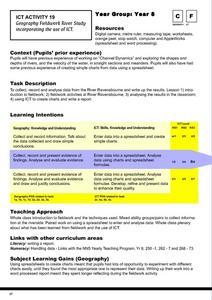
Geography Fieldwork River Study
Eighth graders collect, record, and analyze data from a local river and input the data into the computer. They collect and record the information, discuss the data collected, and enter the data into a spreadsheet and charts to compare...
Curated OER
Predicting Monthly Precipitation
Students should log onto, and collect data from, a specific site on the Internet. They average and compare the data using the Excel spreadsheet program, make predictions from their data, and determine the percent error of their predictions.
Curated OER
SAFETY KNOWLEDGE BASE CHANGES
Middle schoolers research and formulate a hypothesis for research to correlate changing safety regulations in regards to personal and environmental safety polices for storage, handling and disposal of chemicals, risk involved in...
Curated OER
Creating an Enzyme-Substrate Model
Students explore the reaction rates of an enzyme-mediated reaction through experimentation. In small groups, they use everyday objects to demonstrate the effects of environmental variables on enzyme function.
Students graph and...
Curated OER
Butterfly Life Cycle
Second graders explore biology. In this life cycle lesson, 2nd graders act out the stages a caterpillar goes through to become a butterfly. They spend days prior to this lesson observing caterpillars they have collected and developing...
Other popular searches
- Data Handling
- Numeracy Data Handling
- Data Handling Year 4
- Data Handling Math
- Graphs and Data Handling
- Data Handling Projects
- Maths Data Handling
- Graphs Data Handling
- Data Handling Ear 4
- Block Graphs Data Handling
- Data Handling Ice Cream
- Data Handling Lesson Plan


