Curated OER
Data Handling
In this data handling worksheet, students determine biased and unbiased questions to surveys. They explore methods of data collection and design a data collection sheet. This two-page worksheet contains 3 multi-step problems.
Curated OER
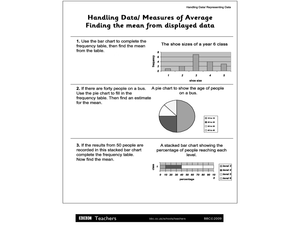
Handling Data/Measures of Average - Finding the Mean from Displayed Data
In this mean and average worksheet, students use the bars and charts to help them find the means using the given data. Students solve 3 problems.
Curated OER
Scientific Data-The Gift That Keeps on Giving!
In this scientific data worksheet, students solve 6 problems related to the data to be collected by the Solar Dynamics Observatory Mission. The problems include finding the number of bytes necessary in discs and drives to store a given...
Statistics Education Web
Types of Average Sampling: "Household Words" to Dwell On
Show your classes how different means can represent the same data. Individuals collect household size data and calculate the mean. Pupils learn how handling of the data influences the value of the mean.
Curated OER
Data Handling: Bar Chart Showing Frequency
In this bar graph worksheet, students analyze a bar graph showing soccer goals scored. Students then use the data to solve 7 problems.
Towson University
Mystery Disease
How did scientists determine the cause of illness before technology? Science scholars play the role of medical researcher in an engaging guided inquiry activity. Using observations, technical reading, and Punnett squares, learners...
Curated OER
Data Handling: Bus Charts
In this data display and analysis worksheet, students study a bar graph that shows the number of people who ride the bus at different times of day. Students use the graph to solve 6 problems. Note: Bus times are shown in 24 hour clock time.
Curated OER
Data Handling
In this data handling worksheet, 6th graders solve and complete 4 various types of problems. First, they draw a bar chart to represent the information provided in the table shown. Then, students show beneath the table how to work out the...
Curated OER
Data Handling: Sorting Shapes
In this recording data and shape sorting instructional activity, students color a chart to show how many green cubes and yellow cylinders are shown. They color the correct number of each shape.
Curated OER
ESL Holiday Lessons: Data Protection Day
In this language skills worksheet, students read an article about Data Protection Day. Students respond to 6 matching questions, 29 fill in the blank questions, 30 multiple choice questions, 12 word scramble questions, 30...
Curated OER
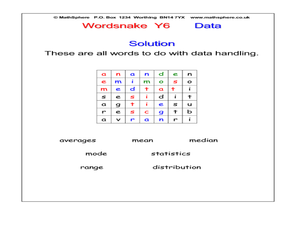
Word Snake: Data
In this data worksheet, students search for words in a word snake, which works like a maze, for words that represent data. Students search for 8 words.
Curated OER
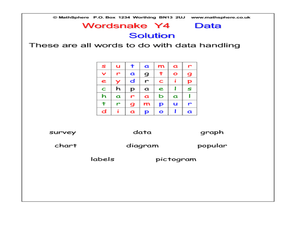
Wordsnake: Data
In this data words worksheet, students search for data words in a wordsnake which looks like a word search. Students look for 7 words.
Curated OER
Data Handling
In this data handling worksheet, students interpret data found in table, graphs and charts. They organize data and draw bar charts. This two-page worksheet contains 2 multi-step problems.
Curated OER
Handling Data- Health Statistics
In this social studies activity, students organize 50 country cards into groups. Students analyze a chart and group countries according to lowest, middle, and highest Infant Mortality Rate.
Curated OER
Data Handling: Tally Chart on Illnesses
In this tally chart worksheet, students analyze a chart showing childhood illness cases. Students use the tally chart to solve 6 problems.
Curated OER
Data Handling: Pictogram of Birds
In this pictograph problem solving worksheet, students analyze a pictograph of birds seen each day for a week. They use the information on the graph to solve 6 problems.
Curated OER
Standard of Living: Data Handling Investigation
In this European standard of living worksheet, students use their research and analytical skills to respond to this hypothesis: The standard of living in the Northern European Countries is far higher than that in the Southern European...
Curated OER
Maps and Lines
In these organizing data worksheets, 5th graders complete four worksheets of activities that help them learn maps, graphs, and lines. Students then study images of maps, lines, and graphs.
Towson University
Case of the Crown Jewels
Can your biology class crack the Case of the Crown Jewels? Junior forensics experts try their hands at DNA restriction analysis in an exciting lab activity. The lesson introduces the concept of restriction analysis, teaches pipetting and...
Teach Engineering
Insulation Materials Investigation
Don't melt away! Pairs investigate different insulation materials to determine which one is better than the others. Using a low-temp heat plate, the teams insulate an ice cube from the heat source with a variety of substances. They...
Curated OER
Can You Bag It?
Put your class's observational skills to the test with a science experiment about paper and plastic bags. After reading some background knowledge about the materials in plastic grocery bags, third graders interpret a chart to answer a...
Curated OER
Tally Chart: Favorite Names
In this data display learning exercise, students analyze a tally chart of favorite hamster names. Using the information on the chart, students solve 8 word problems.
Curated OER
Data Handling
In this data handling learning exercise, students explore multiple ways to represent data. They create stem and leaf plots, histograms, and bar charts. Students examine and interpret diagrams and statistics. This...
University of Georgia
Heating and Cooling of Land Forms
Compare heating and cooling rates of different land forms. A lab activity has groups collect data on the rate of heating and cooling of soil, grass, saltwater, fresh water, and sand. An analysis of the rates shows how the different land...
Other popular searches
- Data Handling
- Numeracy Data Handling
- Data Handling Year 4
- Data Handling Math
- Graphs and Data Handling
- Data Handling Projects
- Maths Data Handling
- Graphs Data Handling
- Data Handling Ear 4
- Block Graphs Data Handling
- Data Handling Ice Cream
- Data Handling Lesson Plan


