Teach Engineering
Energy and the Pogo Stick
Let your class bounce to examine the concept elastic potential energy. Individuals bounce on a pogo stick in order to calculate its elastic potential energy. Groups then compare the elastic potential energy to the gravitational potential...
Willow Tree
Simple Probability
The probability of learning from this lesson is high! Learners calculate probabilities as numbers and as decimals. They see how to use a complement to find a probability and even try a simple geometric probability problem.
Math Worksheets Land
Pie or Circle Graphs—Step-by-Step Lesson
How do you display data that you've collected in a pie chart? Follow a clear step-by-step guide to turning survey results into a visible format. It shows kids how to determine the percentage of the whole that each section represents.
National Institute of Open Schooling
Chemical Arithmetics
Substances with the same empirical and molecular formula must be differentiated by their structural formula. Part two in a series of 36 has pupils using chemical formulas to calculate how much of a compound is present in a given...
Beyond Benign
In a Lather
Time to come clean! Scholars continue preparing the shampoo they created in the previous two lessons. The purpose of this stage is to calculate the perfect amount of additive to make the shampoo lather.
Curated OER
Calculating Baseball Statistics
Students calculate baseball statistics. For this data analysis lesson, students use baseball statistics to calculate the batting average and slugging percentage. Students visit www.funbrain.com to play a math baseball game.
Curated OER
Percentage of Populations with Diabetes
Students calculate percentages. In this percentages lesson, students watch a video clip regarding diabetes. Students discover how to calculate daily carbohydrate allowances as well as the percentage of the population with diabetes.
EngageNY
Solving Percent Problems III
What happens when combining percentage discounts? The last lesson in a series of 29 introduces the idea of combining discounts one after another. Pupils wrestle with the claim that to find the total discount, they need to only add the...
Curated OER
Calculating Simple Interest
In this math worksheet, students investigate the concept of paying interest on a loan. Students read 10 problems where they look at a picture of something they are going to buy at a certain price and interest rate. Students calculate the...
CK-12 Foundation
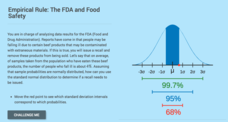
Computing Probabilities for the Standard Normal Distribution: The FDA and Food Safety
To recall or not to recall, that is the question. Using provided data, pupils calculate the percent of people that may fall ill on average. The scholars determine the standard deviation based upon the mean and the empirical rule, then...
EngageNY
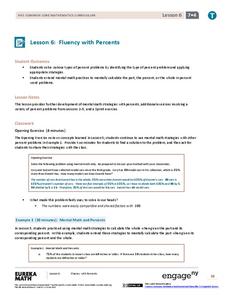
Fluency with Percents
Pupils build confidence working with percents as they work several types of percent problems to increase their fluency. The resource contains two sets of problems specifically designed to build efficiency in finding solutions of basic...
Curated OER
Home Sales Records
Teach your class how to calculate monthly payments on a home mortgage. In this percent lesson, high schoolers calculate the monthly payment on a home mortgage, and compare different lengths of time and the interest rates for national...
Balanced Assessment
Who's Left?
If you're not right-handed, are you wrong-handed? Young statisticians calculate the percentage of left-handed people using a given data set in the assessment task. They plot data on a scatter plot and consider how the line of best fit...
EngageNY
Changing Scales
Pupils determine scale factors from one figure to another and the scale factor in the reverse direction. Scholars compute the percent changes between three figures.
Statistics Education Web
NFL Quarterback Salaries
Use statistics to decide if NFL quarterbacks earn their salaries! Learners study correlation coefficients after using technology to calculate regression equations. Through the data, they learn the meaning of correlation and correlation...
Curated OER
6-8 Baseball Fun: Percentages, Decimals, and Fractions
Middle schoolers practice the concepts behind fractions, decimals, and percents by using sports statistics on baseball cards. In this baseball math lesson plan, students use fractions and estimation to calculate statistics. Middle...
Illustrative Mathematics
Comparing Years
Who knew that the Egyptian, Julian, and Gregorian year were different lengths? Your mathematicians will! They will have to calculate the difference between the years in seconds and find the percent change. Using dimensional analysis,...
Illustrative Mathematics
Area of a Trapezoid
Here is a straightforward example of how to apply the Pythagorean Theorem to find an unknown side-length of a trapezoid. Commentary gives additional information on proving that the inside of the trapezoid is a rectangle, but is...
Curated OER
Fractions and Percentages
In this fraction and percentages worksheet, 6th graders complete a fraction maze, word problems, table and related questions, and calculate percentages and exchange rate questions.
Noyce Foundation
Mixing Paints
Let's paint the town equal parts yellow and violet, or simply brown. Pupils calculate the amount of blue and red paint needed to make six quarts of brown paint. Individuals then explain how they determined the percentage of the brown...
Curated OER
How Credit Card Interest Works
Students experiment with an Excel spreadsheet model that demonstrates the effects of interest on payments. They calculate actual costs, interest paid, and time necessary to pay off credit purchases and draw conclusions about the...
Los Angeles County Office of Education
Assessment For The California Mathematics Standards Grade 6
Test your scholars' knowledge of a multitude of concepts with an assessment aligned to the California math standards. Using the exam, class members show what they know about the four operations, positive and negative numbers, statistics...
Mascil Project
Circular Pave-Stones Backyard
Pack the lesson into your plans. Young mathematicians learn about packing and optimization with the context of circular paving stones. They use coins to model the paving stones, and then apply knowledge of circles and polygons to...
CCSS Math Activities
Smarter Balanced Sample Items: 8th Grade Math – Claim 4
A math model is a good model. A slide show presents 10 sample items on modeling and data analysis. Items from Smarter Balanced illustrate different ways that Claim 4 may be assessed on the 8th grade math assessment. The presentation is...


