Curated OER
Graphing and the Coordinate Plane
Students examine the four quadrants of Cartesian coordinate plane. They play maze games and coordinate games to discover how to read and plot points on the plane. Students plot points on the coordinate plane and examine the ratio of...
Curated OER
Reading Graphs with a Logarithmic Scale
Guide high school meteorologists through a detailed examination of oxygen concentration data. The learners analyze a line graph containing logarithmic data and employ the use of a graphing calculator. A comprehensive worksheet and links...
Tech Know Teaching
5th Grade Constructed Response Question
New to constructed response question worksheets? Here's a model that demonstrates how to construct questions that require readers to interpret graphics found in informational text.
Curated OER
Reading and Sketching Graphs
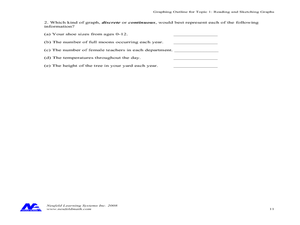
In this graphs worksheet, students answer 15 multistep questions about graphs. Students determine distance traveled, time, velocity, and create scenarios to fit the graph.
EngageNY
Two Graphing Stories
Can you graph your story? Keep your classes interested by challenging them to graph a scenario and interpret the meaning of an intersection. Be sure they paty attention to the detail of a graph, including intercepts, slope,...
DK Publishing
Using Information in Tables
Find out how well can your second or third graders use tables to solve word problems by assigning this single-page worksheet. Two tables with different sets of data prompt learners to solve six problems. An example at the top of the page...
Curated OER
Reading Line Graphs
In this line graphs worksheet, 4th graders, after studying a line graph illustrating Emily's hiking record, answer 4 short answer questions relating to the line graph.
Curated OER
Tim and Pat at the Store: Bar Graphs
Do you like candy? Tim and Pat go to the candy store every day after school. Can you use the chart to determine how much money they spend each day? Does one spend more than the other?
Curated OER
Graphs
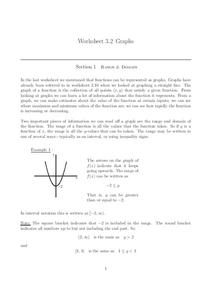
In this graphs worksheet, students solve and complete 15 various types of problems. First, they determine the range of the function of the graph shown and write in interval notation. Then, students find the domain of the function in the...
K12 Reader
Displaying Data
It's important to learn how to display data to make the information easier for people to understand. A reading activity prompts kids to use context clues to answer five comprehension questions after reading several paragraphs about...
Curated OER
Gardening Project-Learning to Grow Seeds
Students demonstrate how to plant seeds. In this gardening lesson, students read the book The Tiny Seed and identify the steps to planting a seed. Students plant their own lima bean seeds in plastic cups and watch it grow.
Baylor College
Living Things and Their Needs: The Math Link
Enrich your study of living things with these cross-curricular math activities. Following along with the story Tillena Lou's Day in the Sun, learners will practice addition and subtraction, learn how to measure volume and length, work on...
Curated OER
Location on a Grid
Make coordinate pairs more engaging by having beginners color-code a grid based on given locations. The grid has numbers along the y-axis and letters along the x-axis, introducing them to the ordering of coordinate pairs with the x-axis...
CCSS Math Activities
Smarter Balanced Sample Items: 8th Grade Math – Claim 3
Communication is the key. A dozen sample items require scholars to communicate their reasoning involved in arriving at a solution. The PowerPoint from the Gr. 8 Claim 2 - 4 Item Slide Shows series uses a variety of content to illicit...
The Alamo
A Teacher’s Guide to Antonio LóPez De Santa Anna
Who was Antonio Lopez de Santa Anna, and how did he relate to the Texas Revolution? Use an informative resource to find out! By reading primary sources, viewing maps and graphs, and answering short-answer written prompts in handouts,...
Federal Reserve Bank
Lesson 4: Back to School
Based on your current level of human capital, how long would it take you to earn $1,000,000? What about your potential human capital? Learners explore the importance of education and experience when entering the workforce, and compare...
Curated OER
Bar Graphs
In this bar graphs worksheet, pupils, working with a partner, explore how to read and analyze the five answers to one mathematical bar graph.
Utah Education Network (UEN)
Linear Relationships: Tables, Equations, and Graphs
Pupils explore the concept of linear relationships. They discuss real-world examples of independent and dependent relationships. In addition, they use tables, graphs, and equations to represent linear relationships. They also use ordered...
Curated OER
1, 2, 3, Read!
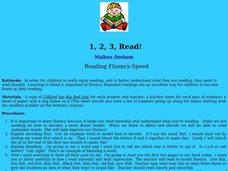
Explain to your readers a variety of decoding strategies to improve their reading fluency. They observe the teacher modeling blending, then in pairs take turns reading the book Clifford the Big Red Dog. Learners then time each other...
Curated OER
Dive Into Reading
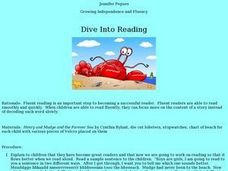
Learners observe and demonstrate various reading strategies to improve their reading fluency. The teacher first models smooth speech. In pairs, pupils take turns reading from the book Henry and Mudge and the Forever Sea by Cynthia...
Curated OER
Locating IIT Using Ordered Pairs
Students investigate ordered pairs. In this math lesson, students plot and locate ordered pairs in a coordinate plane and are exposed to how to read and create a map.
Mathed Up!
Histograms
Class members explore how to read and use histograms by watching a video on creating and analyzing histograms. To finish, the class works on a set of questions that tests these skills.
Curated OER
Graph Mole
Practice graphing ordered pairs by playing an online graphing game. Learners will discover why it is useful to plot coordinates on a xy plane. Graph Mole, is the online game that allows them to practice through a fun, interactive story....
Curated OER
Exploring Renewable Energy Through Graphs and Statistics
Ninth graders identify different sources of renewable and nonrenewable energy. In this math lesson plan, learners calculate their own carbon footprint based on the carbon dioxide they create daily. They use statistics to analyze data on...


