Curated OER
The Ghost of Populations Past
Students study population distribution and survivorship curves by collecting data regarding age of death of humans from either tombstones, newspapers, or other community resources. Students analyze data by creating graphs and population...
Curated OER
Saskatchewan's Population Distribution
Students explore landforms, vegetation, climate and population distribution in Saskatchewan. After discussing an atlas of Saskatchewan, students create their own relief map and climagraphs of Saskathewan. Using specified websistes,...
Curated OER
Population Growth
High schoolers investigate the biodiversity of living things and how they are interdependent upon each other. They conduct research using a variety of resources. Specifically students create a graph to show how a population can grow in...
Curated OER
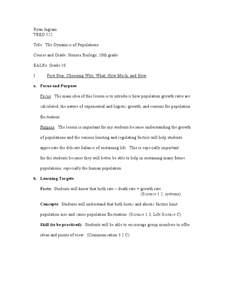
The Dynamics of Populations
Tenth graders analyze the growth rate of different population. For this biology experiment, 10th graders identify the biotic and abiotic factors that limit population size. They create a poster to show their findings in class.
Curated OER
The World Population Explosion
Students are introduced to some of the fundamental questions about the connections among population, resources and energy use, and environmental impacts. They explore population growth, interpret a line graph and calculate their own rate...
Curated OER
Lesson 3: Understanding Population Growth
Young scholars explain population growth in Maryland and its relationship with age structure, household growth and consumption of land.
Curated OER
SC Populations Along Major Interstates
Students examine the population among the interstates in South Carolina. Using the internet, they identify the counties and roads and compare it with their own drawing.
Curated OER
America Moves to the City (1865-1900)
Statistical data can show shifts in human populations without bias or a prescribed historical point of view. View bar graphs and charts that describe new influxes in urbanization, immigration, and suffrage by state during the turn of the...
Curated OER
Take Me Out To the Ball Game
Young scholars use a map to graph and locate major league teams of different sports. In groups, they analyze the population data of the United States and compare it with the amount and location of the major league teams. They share their...
Curated OER
Empty Oceans
In groups of four, pupils brainstorm about seafood. They view the Monterey Bay Aquarium Seafood Watch website to examine the problems caused by the seafood industry. Learners are then brought back together to discuss what they...
Howard Hughes Medical Institute
Patterns in the Distribution of Lactase Persistence
We all drink milk as babies, so why can't we all drink it as adults? Examine the trend in lactase production on the world-wide scale as science scholars analyze and interpret data. Groups create pie charts from the data, place them on a...
Howard Hughes Medical Institute
Got Lactase? Blood Glucose Data Analysis
Many physicals include a blood glucose test, but what are doctors actually testing? Scholars graph and interpret blood glucose data, allowing them to observe the differences in lactase persistence and draw conclusions. They then connect...
Curated OER
Population Biology
In this population worksheet, students will compare two graphs; one graph representing steady rate of growth and the other one showing exponential growth. Students will use these graphs to complete 3 short answer questions.
Curated OER
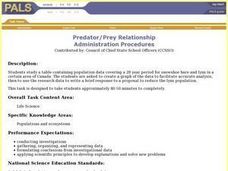
Predator/Prey Relationship
Students study and analyze data collected on the relationship between the snowshoe hare and lynx in Canada over a 28 year period and create a graph. Students also write a response to a proposal to reduce the lynx population.
Curated OER
Understanding Groundwater & the Effects of Pollution
Students complete a unit on the effects of pollution on our water supply. They create a graph to examine the density of earth's land surface, round the population to the nearest hundred million place, participate in a...
Curated OER
You Need How Much Food When? Where?
Ninth graders explore how human activities shape the earth's surface. In this awareness instructional activity, 9th graders create pictographs showing the relations of food, people, land, and resources. Students complete worksheet.
Curated OER
Using Charts and Graphs to Study East Asia's Modern Economy
Students examine East Asia's modern economy. In groups, classmates use the internet to compare the resources, products, and economy of specified countries. After collecting the data, pupils create charts, tables and graphs. They...
Curated OER
Ecology: Factors Influencing Animal Populations
Students assess the factors affecting animal populations. Working in groups they define specific vocabulary terms and complete several activities from "Project Wild."
Curated OER
Lobster Roll!
Students collect data by playing a game that illustrates the delicate ecological balance between fishing, fishing regulations and fish populations. They graph and analyze the data and explain how economic decisions can affect the...
Curated OER
Video on Exponential Growth
Students watch a video on exponential growth and discuss the different graphs. In this calculus lesson, students analyze graphs using examples from the fish population, human population and investments. They discuss compounding interest...
Curated OER
Understanding "The Stans"
Students explore and locate "The Stans" in Central Asia to create, write and illustrate maps, graphs and charts to organize geographic information. They analyze the historical and physical characteristics of Central Asia via graphic...
Consortium for Ocean Science Exploration and Engagement (COSEE)
Climate Change Impacts on Blue King Crabs
Carbon dioxide is not only causing global temperatures to increase, it causes the oceans to become more acidic. Lesson focuses on the blue king crab and the fragility of the habitat due to climate change. Scholars create a concept map...
Curated OER
Understanding Growth of the Phoenix Area
Students study the growth of the Phoenix area using geographic images, maps, tables, and graphs. They study the idea of community.
Teach Engineering
Energy Intelligence Agency
Protect the world from energy depletion—join the Energy Intelligence Agency. Using a set of cards, pupils distinguish between correct and incorrect information regarding energy use in the United States. They analyze graphs and diagrams...


