Curated OER
Using Bar Graphs to Understand Voting Patterns
Bar graphs are used as a way to study voting patterns in the United States. A variety of statistical data is presented in the graphs, and pupils must interpret the data in order to make a report to the class. Three excellent graphs,...
Curated OER
Historic Population Chart
Students examine the changes in the population in Idaho over a specific amount of time. In groups, they use the digital atlas to identify the trends in the population and describe why and how they exist. To end the lesson, they compare...
Curated OER
Population Pyramids
Students explain the significance of population trends on world regions. They define relevant population vocabulary and examine age-gender patterns at various scales.
School Improvement in Maryland
Demographic Investigation
What are the factors that influence voting patterns? How do these factors influence government funding? Is participation the squeaky wheel gets the grease? Class members interpret graphs and analyze trends to determine what...
Curated OER
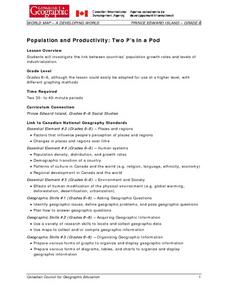
Population and Productivity: Two P's in a Pod
Students investigate the link between countries' population growth rates and levels of industrialization. They observe that, over time, as a country becomes more industrialized, its population growth rate decreases.
Curated OER
In the Wake of Columbus
Students explore how the population decreased in native cultures.
Curated OER
Population Dynamics
Students investigate the causes and consequences of population growth and the envrionmental factors that contribute to it. They discuss what they think the world's population will be in 2050.
Population Connection
Where Do We Grow from Here?
Did you know that the population is expected to grow to 11 billion by 2100? The resource serves final installment in a six-part series on the global population and its effects. Scholars interpret data from the United Nations about the...
Curated OER
Where is Everybody?
Students collect data from different grade levels at their school and develop thematic maps which show population density, and determine how this might affect the school and themselves in the future.
Curated OER
Populations in the Path of Natural Hazards
Students read "Geographical Mobility: 1995-2000." They examine the maps in the handouts and compare them with maps from an atlas. In the second part of this lesson, students read "In Harm's Way." They receive three more handouts, one a...
Curated OER
Human Ecology: How it Relates to Population
Ninth graders are introduced to the concept of population. In groups, they research the problems associated with overpopulation and underpopulation. They practice calculating birth and death rates and discus how they can be used to...
Population Connection
A Demographically Divided World
Did you know that birth and life rates vary across the world? The resource, the second in a six-part series, discusses just how demographics differ across countries and why it might be the case. Scholars complete worksheets, watch...
Curated OER
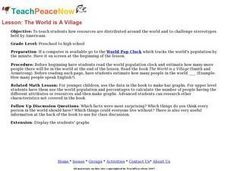
The World is a Village
Students observe Americans through the eyes of the world. In this human population lesson plan, students utilize the Internet to view the World Pop Clock and follow the world's population by the minute. Students predict what...
Curated OER
World Population Study
Students explore an exponential relationship and how it relates to human population growth and the current global population crisis. They graph both exponential and linear information.
Curated OER
WORLD POPULATION STUDY
Students explore an exponential relationship and how it relates to human population growth and the current global population crisis.
Population Connection
The Peopling of Our Planet
How many people live on the planet, anyway? The first resource in a six-part series covers the topic of the world population. Scholars work in groups to conduct research and make population posters after learning about the global...
Curated OER
Create a City: An Urban Planning Exercise
Students explore the effects of population growth in Arizona. In this history lesson plan, students work in small groups to create a "perfect" city. Activities include examining the Arizona census results then discussing the...
Curated OER
Planet Earth: Almost 6 Billion Served
Young scholars investigate the global population explosion, by comparing India's and China's population control efforts and results. They interpret the UN's Human Development Report, and conduct research on another highly-populated country.
Curated OER
Epidemic Proportions
Students research epidemics that have devastated world population at various points in history. They share and calculate statistics obtained in their research and develop graphs comparing and contrasting how different epidemics affect...
Curated OER
Saskatchewan's Population Distribution
Students explore landforms, vegetation, climate and population distribution in Saskatchewan. After discussing an atlas of Saskatchewan, students create their own relief map and climagraphs of Saskathewan. Using specified websistes,...
Curated OER
The World Population Explosion
Students are introduced to some of the fundamental questions about the connections among population, resources and energy use, and environmental impacts. They explore population growth, interpret a line graph and calculate their own rate...
Curated OER
SC Populations Along Major Interstates
Students examine the population among the interstates in South Carolina. Using the internet, they identify the counties and roads and compare it with their own drawing.
Curated OER
America Moves to the City (1865-1900)
Statistical data can show shifts in human populations without bias or a prescribed historical point of view. View bar graphs and charts that describe new influxes in urbanization, immigration, and suffrage by state during the turn of the...


