Curated OER
Slopes of Lines
Students examine a graph and relate it to the real world situation it depicts. They investigate changes in an equation and the appearance of a line. They investigate the connection between the graph of a situation and the meaning of the...
Curated OER
Shapes and Introduction to Geometry
Students make a quilt. In this geometry instructional activity, students discuss patchwork quilts and learn some different geometric shapes and patterns that are commonly used. Students explore designs with triangles and squares and then...
Curated OER
Is the Hudson River Too Salty to Drink?
Students explore reasons for varied salinity in bodies of water. In this geographical inquiry lesson plan, students use a variety of visual and written information including maps, data tables, and graphs, to form a hypothesis as to why...
Curated OER
The Great Pollinators
Students discover the reproductive parts of a plant. In this biology lesson, students identify and categorize several different plants they dissect in class. Students record their information using a data chart.
Curated OER
Surface Area and Measuring
Tenth graders explore volume and surface area through percentages. In this geometry lesson plan, 10th graders analyze the surface area of two and three dimensional shapes, then use percents and ratio to compare the two.
Curated OER
Polyhedra
Students analyze convex polyhedra through hands on methods. In this geometrical shapes lesson, students construct paper models of convex polyhedra and identify the different properties including the number of sides, faces and edges.
Alabama Learning Exchange
Creating a Reflection
Investigate geometric reflections in this geometry lesson. Create geometric reflections that show the reflection across the x and y axis of a coordinate graph. Learners watch a teacher demonstration before proceeding on their own. They...
Curated OER
Equations Lesson Plan
Seventh graders play "What's my Rule" beginning with simple equations and working towards harder problems as student's gain confidence. They evaluate the equations by graphing them. Students identify the slope and y intercepts of the...
Curated OER
Math: a World of Symmetry
Students expand their knowledge of quadrilaterals and identify basic symmetrical forms. Over three weeks, they explore the math, application, and discussion of symmetry. After conducting Internet research, students create symmetrical...
Curated OER
Symmetries of Strip Patterns
Students study strip patterns and identify symmetry. They create a paper doll chain. They experiment with different shapes. They determine if their chain is a strip pattern. They create snowflakes with triangles.
Curated OER
Problem Solving in Mathematics
Seventh graders discover that there are multiple strategies to be used in problem solving. They explain a problem solving situation in their own words and determine a possible strategy for solving the problem.
Curated OER
Which Fish Where?
Here is a lesson plan outline that prompts elementary young scholars to graph and analyze data regarding fish caught along the Hudson River. They will review vocabulary and complete 2 worksheets which can be accessed by clicking on the...
Curated OER
Fraction Strips
Get a handle on equivalent fractions through the use of manipulatives. Using area models, sets, and length manipulatives like fraction strips and Cuisenaire rods, the class will gain a deeper understanding of equivalent fractions....
Curated OER
Translating Transformations in Geometry
High schoolers create an image using given coordinates and evaluate how the coordinates change when a slide or rotation takes place.
Curated OER
Scholarship and Learning in Islam
Students explain what a madrasah represents in Islam. Using the Muslim world as an example, they identify and describe two or more centers of learning. They explain the contributions that Muslims have made to science and math and...
Curated OER
Pattern Puzzlers
Students identify triangles, circles, and squares, then show their understanding of patterns by continuing a pattern that contains three different elements. They utilize worksheets imbedded in this plan to practice using these shapes.
Curated OER
Patterns, Relations, and Functions: Lesson 3: Numerical Patterns
Fourth graders extend and continue numerical patterns using function or input/output machines. They finish the increasing patterns using input/output tables, and generalize the rules that apply to the pattern. They complete the...
Curated OER
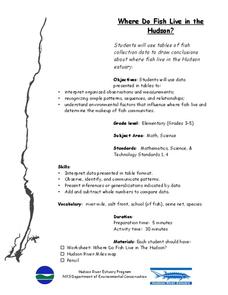
Where Do Fish Live in the Hudson?
Students explore the environmental factors that influence where fish live and determine the makeup of fish communities in the Hudson. They interpret guided observations and measurements to assess patterns, sequences and relationships.
Curated OER
Fish Communities in the Hudson
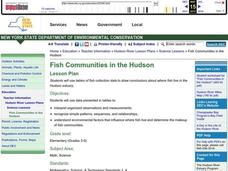
Students use tables of fish collection data to draw conclusions about where fish live in the Hudson Estuary. Given available data they interpret organized observations and measurements and recognize simple patterns, sequences, and...
Curated OER
Dream Car Math
Students collect car cost comparison data from the "Car Wizard" web site to use as problem solving and for calculations related to math.
Curated OER
How Many Bears in the Forest?
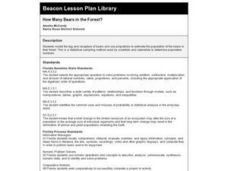
Third graders model the tag and recapture of bears and use proportions to estimate the population of the bears in their forest. This is a statistical sampling method used by scientists and naturalists to determine population numbers.
Curated OER
More or Less Pigs in the Pen
Students practice simple addition and subtraction. They identify relationships among whole numbers.
Curated OER
No-Three-In-A-Line Again
Learners interpret information and results in context while using words and symbols to generalize patterns. They use symmetry and angle properties of polygons to solve practical problems and identifying invariant properties under...
Curated OER
Ants
Young scholars make sequential patterns by using ants and following the model. They identify different parts of an ant by matching the picture to the word name. Pupils identify the ant's life cycle by creating a chart using pictures.


