Noyce Foundation
Granny’s Balloon Trip
Take flight with a fun activity focused on graphing data on a coordinate plane. As learners study the data for Granny's hot-air balloon trip, including the time of day and the distance of the balloon from the ground, they practice...
Curriculum Corner
7th Grade Math "I Can" Statement Posters
Translate the Common Core math standards into a series of achievable "I can" statements with this collection of classroom displays. Offering posters for each standard, this resource is a great way to support your seventh graders as...
Inside Mathematics
Party
Thirty at the party won't cost any more than twenty-five. The assessment task provides a scenario for the cost of a party where the initial fee covers a given number of guests. The class determines the cost for specific numbers of guests...
Inside Mathematics
Sorting Functions
Graph A goes with equation C, but table B. The short assessment task requires class members to match graphs with their corresponding tables, equations, and verbalized rules. Pupils then provide explanations on the process they used to...
Chicago Botanic Garden
Plant Phenology Data Analysis
Beginning in 1851, Thoreau recorded the dates of the first spring blooms in Concord, and this data is helping scientists analyze climate change! The culminating instructional activity in the series of four has pupils graph and analyze...
Fredonia State University of New York
Watch Your Step…You May Collide!
Can two lines intersect at more than one point? Using yarn, create two lines on the floor of the classroom to find out. Cooperative groups work through the process of solving systems of equations using task cards and three different...
University of Colorado
Spacecraft Speed
Space shuttles traveled around Earth at a speed of 17,500 miles per hour, way faster than trains, planes, or automobiles travel! In the 13th installment of 22, groups graph different speeds to show how quickly spacecraft move through...
Virginia Department of Education
Nonlinear Systems of Equations
Explore nonlinear systems through graphs and algebra. High schoolers begin by examining the different types of quadratic functions and their possible intersections. They then use algebraic methods to solve systems containing various...
Concord Consortium
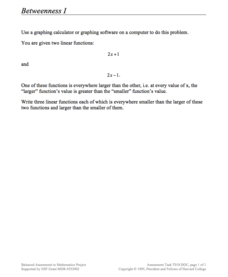
Betweenness I
Just between us, this is a pretty cool lesson! Given two functions with the same slope, learners write three new functions whose outputs are all between the given functions. The question is open-ended, allowing pupils to explore the...
Worksheet Web
Using Pictographs
If one ice cream cone represents three ice cream scoops, and Bob has four ice cream cones, then how many scoops does Bob have? Learners solve these kind of questions with their new understanding of pictographs.
Concord Consortium
Rectangle Space
Take a coordinated look at rectangles. The task asks pupils to plot the length and width of created triangles in the coordinate plane. Using their plots, scholars respond to questions about rectangles and their associated points on the...
Mathematics Assessment Project
Functions
Studying function means more than simply learning a formula. Learners must use functions to think through four problems and find solutions. Each task utilizes a different concept from a study of functions. Class members might...
Curated OER
Problem Solving Application: Using a Bar Graph
In this bar graph worksheet, students use a set of 2 bar graphs to answer 6 related questions. Answers are included on page 2. A reference web site is given for additional activities.
Curated OER
Linear Inequalities
Students imagine that they own a sneaker company. They are asked how they would know if their company made a profit. Students determine the number of sneakers of each type they need to sell in order to "break even." They are asked how...
Curated OER
Compound Inequalities
Students solve problems with compound inequalities. For this algebra lesson, students solve inequalities using addition, subtraction, multiplication and division. They graph-their solutions on a numbers line.
Curated OER
Easter Bar Graph - (B)
In this math review worksheet, students complete addition, subtraction, multiplication, and division problems and put their answers into a bar graph that represents calories. Students complete 13 problems and 1 graph.
Curated OER
System of Two Quadratic Inequalities
Students graph a quadratic inequality and describe its solution set. They solve a system of quadratic equalities graphically and symbolically and as related to a real-world context.
Curated OER
What on Earth is Greater Than?
Students compare things that are greater than, less than, or equal to, compare the Earth to other planets, and list planets from greatest size to smallest size.
Curated OER
Graphing Linear, Circular, and Parabolic Inequalities
In this graphing worksheet, students are given nine inequalities and then must graph five of their intersections. A grid and cartoon hint are provided.
Curated OER
Lesson Plan 3: Inequalities
Ninth graders study inequalities. After a teacher demonstration, classmates solve and graph inequality problems. In groups, they are assigned specific tasks that lead to the solving of inequality word problems.
Curated OER
Linear Inequalities
In this linear inequalities worksheet, 11th graders solve and complete 9 different problems that include various linear inequalities. First, they draw a number line to determine their equals portion and make the appropriate notation....
Curated OER
Systems of linear inequalities in standard form
Learners practice graphing linear inequalities and explain their solution sets to the solving of a system of linear equalities graphically and symbolically. They utilize programming techniques in setting up and solving systems of linear...
Curated OER
Systems of Linear Inequalities
In this systems of linear inequalities worksheet, 9th graders solve 10 different problems that include various linear inequalities. First, they solve each equation for y. Then, students graph each individual inequality and locate where...
Curated OER
Learning to Make Bar Graphs
Students construct bar graphs using the results from various experiments. In this graphing lesson, students review data from a previous experiment and demonstrate how to construct a bar graph. Students use a checklist to ensure...


