Curated OER
Temperature Effects on Solubility
Learners determine the solubility of salt in water at three different temperatures and graph the results. They use the following skills: observing, inferring, and graphing.
Curated OER
Is It There?
Students participate in a instructional activity designed to illustrate these concepts using simple materials. They use Science process skills to observe, measure, predict, make inferences, and communicate while completing the activity....
Curated OER
Colored Dots 1
Learners observe that colored markers are a mixture of many different colors by performing a chromatography experiment. They make observations, record information, and make generalized inferences from their observations.
Curated OER
Layering the Air
Students study the layer of the atmosphere. In this lesson on the atmosphere, students discuss the composition of the air around us and how the atmosphere was formed. Students create a scale model of the layers of the atmosphere.
Curated OER
A Snapshot of the Connecticut River Valley - 1880
Students analyze a variety of images and documents and make inferences from their readings and articulate causality.
Curated OER
Go Jump In The Lake!
Learners experiment with local lake water to determine the health of the lake waters. They explore the human impact on the lake water, hypothesize and share inferences in a scientific report.
Curated OER
Learning From Leaves: A Look at Leaf Size
Students measure and analyze leaves from various environments. They discuss the environments, and make inferences about environmental variables that could have contributed to the differences in leaf size and texture.
Curated OER
Experiences and Experiments - There is a Difference
Sixth graders plan and conduct an experiment on food spoilage. They design the experiment, create a display, record and analyze data, and make inferences regarding the results of the experiment.
Curated OER
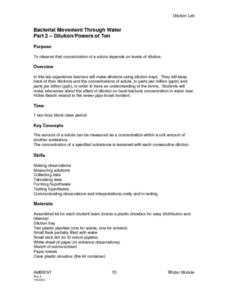
Bacterial Movement Through Water Part 2- Dilution/Powers of Ten
Learners make dilutions using dulution trays. They keep track of their dilutions and the concentrations of solute, to parts per million (ppm) and parts per billion (ppb), in order to have an comprehension of the terms. Students make...
Curated OER
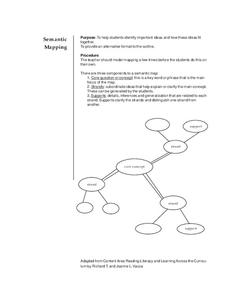
Semantic Mapping
Pupils explore semantic mapping. Through teacher modeling and independent practice they complete a variety of semantic (concept) maps to coincide with specific areas of subject matter. They identify the core concept and include...
Curated OER
Stemmin'-n-Leafin'
Students make stem and leaf charts to determine the measures of central tendency using test score data. They analyze the data to draw inferences which they share with the class. They complete the associated worksheets.
Curated OER
Introduction to the Scientific Method
Students designs and conduct a scientific experiment that identifies the problem, distinguishes manipulated, responding and controlled variables, collects, analyzes and communicates data, and makes valid inferences and conclusions.
Curated OER
What Makes you Hot?
Learners manipulate different variables in a model and make inferences about the temperature on Earth. In this heat lesson students calculate the blackbody radiation of an object at a certain temperature.
Curated OER
Rhetorical Devices
Twelfth graders identify and analyze examples of rhetorical devices as valid or invalid inferences. In this text analysis lesson, 12th graders research a controversial topic in teams and identify rhetorical devices for the topic....
Curated OER
Catches and landed value of fish
Students analyze data. In this secondary mathematics lesson plan, students read and retrieve data from a statistical table on the Canadian fishing industry. Students interpret and describe data in mathematical terms and make...
Curated OER
Immigration/Migration
Sixth graders investigate the immigration into America by researching Ellis Island. In this United States History lesson, 6th graders research the Internet to view photographs and find information about the immigration to Ellis Island....
Curated OER
Height of Bounce
Eighth graders determine the relationship between the height of bounce of a ping-pong ball and the height from which it was dropped. They are assessed on the ability to record and interpret data, graph data, make predictions, and make...
Curated OER
Sound Box
Students make simple observations and identify relevant variables, such as frequency and diameter. They then discuss the relationship between variables. The task assesses students' abilities to make simple observations and make...
Curated OER
Starch and Sugar Testing 2
Students design and conduct an experiment to determine which of three solutions contain starch or sugar. This task assess students' ability to make simple observations, design simple experiments, utilize indicators, and make generalized...
Curated OER
Identifying Differences Between Fiction and Nonfiction Books
Students explore the differences between fiction and non-fiction book. In this genre study lesson, students read examples of fiction and non-fiction and identify the characteristics of each genre. Students list the characteristics on a...
Curated OER
Conducting and Analyzing Local Studies
Learners carry out the class weather study: recording, organizing and discussing data daily and keeping track of this work in their journals. They look for patterns and relationships in data, link these with what they know and with...
Curated OER
Remembering September 11
Students explore the impact of September 11 on American society through analysis of interviews and class discussions. Students evaluate the historic importance of the Gettysburg Address.
Curated OER
Max Knows Mexicao, United States and Canada
Students utilize their map skills to explore the regions of North America. They explore the physical characteristics and climates of the regions. Students label their map and prepare a presentation of their findings.
Curated OER
Keep It Cool
Students complete a science experiment to study insulation, heat transfer, and permafrost. For this permafrost study lesson, students design and test a soda insulator. Students graph their class data and discuss the results. Students...
Other popular searches
- Teaching Inference Skills
- Inference Skills First Grade
- Reading Inference Skills
- Powerpoint Inference Skills
- Inference Skills in Reading
- Inference Skills Worksheet
- Science Inference Skills
- Inference Skills Sixth Grade


