Science Matters
Earthquake Waves: Wave Notes
A multi-part lesson opens with a review of p waves and s waves. Then scholars use a simple s wave simulator to view the way the wave travels. Next, pupils use cups and various fluids to simulate p waves moving through different mediums....
Sunburst Visual Media
Clouds
Support science instruction with a combination of engaging activities and skills-based worksheets that focus on clouds. Learners take part in grand discussions, write an acrostic poem, complete graphic organizers, solve word puzzles, and...
National Security Agency
Classifying Triangles
Building on young mathematicians' prior knowledge of three-sided shapes, this activity series explores the defining characteristics of different types of triangles. Starting with a shared reading of the children's book The Greedy...
Code.org
Practice Performance Task - Security and Hacking in the Real World
Young computer scientists create a visual artifact that represents their research into a computing innovation in the world of cybersecurity. They then work individually to write an essay on the impact of technology on cybersecurity.
Science Matters
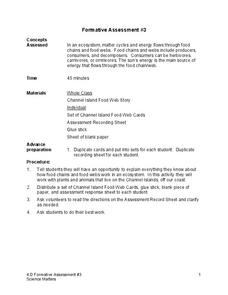
Formative Assessment #3
Thirteen short-answer questions follow a brief food web activity in a formative assessment designed to test knowledge of ecosystems and the energy that flows through them.
ReadWriteThink
Critical Media Literacy: Commercial Advertising
Commercial advertising—we can't get away from it, but do we realize just how often we are being advertised to? With this lesson, scholars analyze mass media to identify how its techniques influence our daily lives. Learners browse...
Inside Mathematics
Squares and Circles
It's all about lines when going around. Pupils graph the relationship between the length of a side of a square and its perimeter. Class members explain the origin in context of the side length and perimeter. They compare the graph to the...
Virginia Department of Education
Angles, Arcs, and Segments in Circles
Investigate relationships between angles, arcs, and segments in circles. Pupils use geometry software to discover the relationships between angles, arcs, and segments associated with circles. Class members use similar triangles to...
Virginia Department of Education
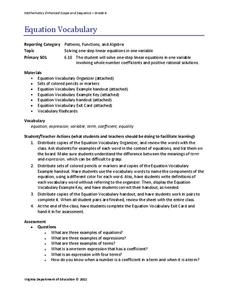
Equation Vocabulary
You'd feel bad if someone called you by the wrong name — and equations are no different. Young mathematicians learn the vocabulary associated with equations and expressions identifying these components in sample equations.
New York State Education Department
Comprehensive English Examination: August 2012
Looking for a resource to wrap up all English skills in one? Here's a comprehensive resource that includes listening and reading passages, responding to poems, writing an essay, and analyzing a quote. The packet includes passages and...
University of California
The Civil War: The Road to War
The United States Civil War resulted in the highest mortality rate for Americans since the nation's inception. Delve deeper into the causes for the drastic separation of states with a history lesson plan that features analysis charts,...
Bowland
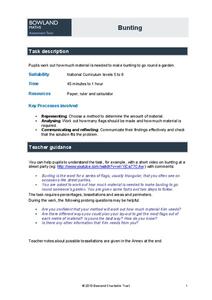
Bunting
How much fabric is necessary for bunting? Scholars use given dimensions of triangular bunting (hanging decorations) to determine the amount of fabric necessary to decorate a rectangular garden. The task requires pupils to consider how...
Bowland
Public Transport
"Statistics is the grammar of science" -Karl Pearson. In the assessment task, learners read a claim made by a newspaper and analyze its conclusions. They need to think about the sample and the wording of the given statistics.
EngageNY
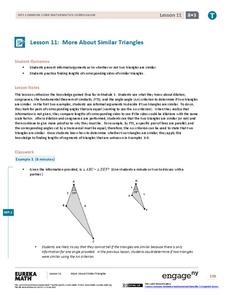
More About Similar Triangles
Determine whether two triangles are similar. The lesson presents opportunities for pupils to find the criterion needed to show that two triangles are similar. Scholars use the definition of similarity to find any missing side...
EngageNY
Proving the Area of a Disk
Using a similar process from the first lesson in the series of finding area approximations, a measurement resource develops the proof of the area of a circle. The problem set contains a derivation of the proof of the circumference formula.
Bowland
Speedy Santa
Santa sure is fast. In the assessment task, learners calculate the number of minutes Santa can spend at each house. This calculation requires the use of given population demographics data.
EngageNY
Using Sample Data to Compare the Means of Two or More Populations
Determine whether there is a difference between two grades. Teams generate random samples of two grade levels of individuals. Groups use the mean absolute deviation to determine whether there is a meaningful difference between the...
EngageNY
The Volume Formula of a Sphere
What is the relationship between a hemisphere, a cone, and a cylinder? Using Cavalieri's Principle, the class determines that the sum of the volume of a hemisphere and a cone with the same radius and height equals the volume of a...
Bowland
German or English?
Sprechen sie Deutsch? Future cryptographers must decide whether an unknown text is written in English or in German. They use provided pie charts about the frequency of words in the English and German languages to help make their decisions.
Bowland
Problem Page
Future mathematicians use a given graph to answer a question about age differences in relationships. Along the way, they must find the equation and inequality of given graphs.
EngageNY
Using Sample Data to Compare the Means of Two or More Populations II
The 23rd segment in a series of 25 presents random samples from two populations to determine whether there is a difference. Groups determine whether they believe there is a difference between the two populations and later use an...
EngageNY
Equivalent Ratios
Equivalent ratios show up on tape. Young mathematicians use tape diagrams to create equivalent ratios in the initial lesson on the topic. They learn the definition of equivalent ratios and use it to build others in the third segment of a...
EngageNY
Comparison Shopping—Unit Price and Related Measurement Conversions II
Which rate is greater and by how much? Pupils continue to compare rates to solve problems in the 20th portion of a 29-part series. Rates are presented in a variety of representations either using the same representation or different...
EngageNY
The Mean Absolute Deviation (MAD)
Is there a way to measure variability? The ninth resource in a series of 22 introduces mean absolute deviation, a measure of variability. Pupils learn how to determine the measure based upon its name, then they use the mean absolute...


