ARKive
Handling Data: African Animal Maths
Handling and processing data is a big part of what real scientists do. Provide a way for your learners to explore graphs and data related to the animals that live on the African savannah. They begin their analysis by discussing what they...
Inside Mathematics
Swimming Pool
Swimming is more fun with quantities. The short assessment task encompasses finding the volume of a trapezoidal prism using an understanding of quantities. Individuals make a connection to the rate of which the pool is filled with a...
Curated OER
Historical Population Changes in the US
Students conduct research on historical population changes in the U.S. They conduct Internet research on the Historical Census Data Browser, create a bar graph and data table using a spreadsheet program, and display and interpret their...
Inside Mathematics
House Prices
Mortgages, payments, and wages correlate with each other. The short assessment presents scatter plots for young mathematicians to interpret. Class members interpret the scatter plots of price versus payment and wage versus payment for...
Illustrative Mathematics
Velocity vs. Distance
At the end of this activity, your number crunchers will have a better understanding as to how to describe graphs of velocity versus time and distance versus time. It is easy for learners to misinterpret graphs of velocity, so have them...
Curated OER
Dental Detectives
First graders explore the theme of dental health and hygeine. They make tooth loss predictions, count lost teeth, and graph tooth loss. In addition, they listen to dental health stories, read online stories, create spreadsheets, and play...
Illustrative Mathematics
Invertible or Not?
What determines whether a function has an inverse? Learners investigate that criteria when they examine values in a partially completed input-output table for two different functions. The task is to complete the table so that one of the...
Illustrative Mathematics
Influenza epidemic
This activity presents a real-world problem about an epidemic of influenza spreading through a city. Learners refer to a graph that shows the number of individuals infected in relation to the number of weeks that have elapsed since...
Illustrative Mathematics
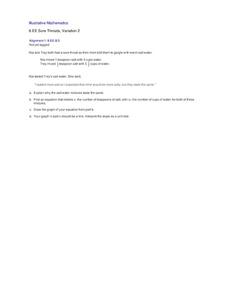
Sore Throats, Variation 2
What does math have to do with a sore throat? When you mix water and salt you have a great review of how to represent proportional relationships by an equation or graph. Here the proportions of the mixtures may be different, but the...
It's About Time
Volcanic Hazards: Airborne Debris
Pupils interpret maps and graph data related to volcanic ash. Then they analyze the importance of wind speed and the dangers of the ash to both life, air temperature, and technology.
EngageNY
Modeling a Context from a Verbal Description (part 2)
I got a different answer, are they both correct? While working through modeling problems interpreting graphs, the question of precision is brought into the discussion. Problems are presented in which a precise answer is needed and...
EngageNY
Modeling with Quadratic Functions (part 1)
Relevance is key! The resource applies quadratic modeling by incorporating application of physics and business. Pupils work through scenarios of projectile motion and revenue/profit relationships. By using the key features of the graph,...
Curated OER
Latitude
Your young geologists generate a graph given a table of values from the context of latitude and percent of the earth's surface north of that latitude. The questions in the activity then focus the learners to a deeper understanding of the...
Noyce Foundation
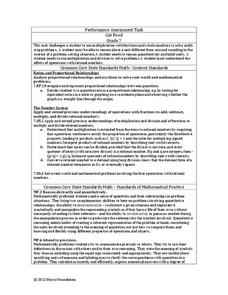
Cat Food
Determine the right mix of cans of cat food. The resource consists of an assessment task to determine the cost to feed two cats for a specific number of days and requires scholars to interpret remainders within a context....
American Statistical Association
Scatter It! (Predict Billy’s Height)
How do doctors predict a child's future height? Scholars use one case study to determine the height of a child two years into the future. They graph the given data, determine the line of best fit, and use that to estimate the height in...
Curated OER
Delivery Trucks
Written to assess learners' knowledge of interpreting expressions that represent a quantity in terms of its context, this machine-scored task also allows for a good discussion about units guiding the problem solving and solution.
Curated OER
The Parachute
Students discuss parachutes and write a procedure to determine the effect of different size parachutes and different masses on the time it takes the masses to fall. They record all their data from their experiment then write three...
Curated OER
Using Your Marbles - Volume Measurement and Reporting
Demonstrate how to measure the volume of liquids and solids immersed in liquid to your class. They observe a teacher-led demonstration, and in small groups construct a data table that demonstrates how many marbles were used and the...
Curated OER
Systems of Equations and Real Life
What a great classroom resource! The intention of this lesson is to show that real-world math can and should be applied to the community in which your students reside. The class relates properties of equations to solving for species...
Achieve
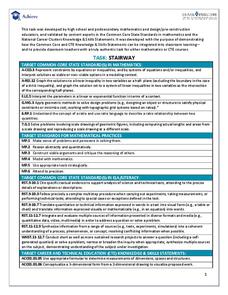
Stairway
It's the stairway to learning! Scholars research all aspects of building a staircase. Using information from building codes, they write and graph a system of inequalities to analyze the constraints. The completed project is a scale model...
Curated OER
Exponential Functions
Your algebra learners analyze and interpret the general form and the graph of two functions. The increase of the function due to the multiplicative factor is emphasized.
Curated OER
Unit II: Worksheet 1 - Velocity
Beginning physics scholars interpret two graphs depicting position versus time. For each graph, there is a series of questions to answer. The exercise is basic, but beneficial. Consider using it as an assessment of understanding after...
EngageNY
Comparing Quadratic, Square Root, and Cube Root Functions Represented in Different Ways
Need a real scenario to compare functions? This activity has it all! Through application, individuals model using different types of functions. They analyze each in terms of the context using the key features of the graphs.
Alabama Learning Exchange
Human Slope
Middle and high schoolers explore the concept of slope. In this slope lesson, learners graph lines using a life-size graph. They use chalk on a blacktop to create a coordinate plane and use each other as the tick marks on the grid....
Other popular searches
- Interpret Graphs and Charts
- Read and Interpret Graphs
- Graphs Interpret
- Interpret Graphs Science
- Interpret Graphs and Data
- Use and Interpret Graphs
- Interpret Graphs and Science
- Algebra Interpret Graphs
- Graphs Interpret Plot


