Curated OER
A Quick Review of Perfect Competition and Monopoly
Put your learners' competitive interests to the test in this worksheet, which includes ten multiple choice questions that relate to two graphs. One graph details a monopoly, while the other displays a perfectly competitive system....
Curated OER
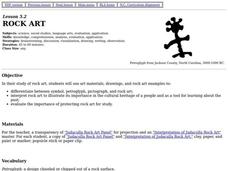
Rock Art
Fourth graders examine and interpret rock art to illustrate its importance in the cultural heritage of a people and as a tool for learning about the past. They create their own rock art that is a symbol of their culture.
Curated OER
Data Handling
In this data handling worksheet, students explore multiple ways to represent data. They create stem and leaf plots, histograms, and bar charts. Students examine and interpret diagrams and statistics. This eleven-page...
Curated OER
Cruising the Internet
Students identify the parts of an engine using a graph. In this statistics lesson, students make a graph from their collected data. They calculate the volume of a cylinder using a line of regression and a scatter plot.
Curated OER
How to Make Histograms
Learners collect data and plot it using a histogram. In this statistics lesson, students interpret histograms. They find the frequency, percents and density.
Curated OER
Don't Let Parabolas Throw You
Students identify relation, function, patterns and range. For this algebra lesson, students factor and graph quadratic equations. They use transformation to move the parabola around and make predictions.
Curated OER
Thanksgiving Feast (Read the Charts)
Students practice reading charts about foods country of origin. They interpret information and answer questions related to charts. They discover how food production adds to the economy.
Curated OER
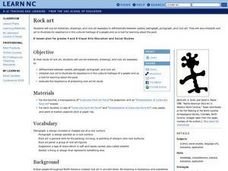
Rock art
Students study rock art they use art materials, colored photographs and rock art examples to: differentiate between symbol, petroglyph, pictograph, and rock art. They interpret rock art to illustrate its importance in the cultural...
Curated OER
Cinco De Mayo
Students make a graph identifying the immigration of Mexicans to the US. In this algebra lesson, students practice graphing as they review different trends in immigration over the past 100 years. They interpret and analyze their graphs.
Curated OER
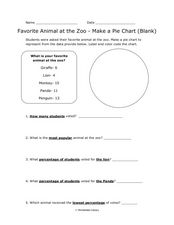
Pie Chart: Favorite Animal at the Zoo
In these three interpreting a pie chart and answering questions worksheets, students use the data provided to label and color code the blank and outlined pie charts, read and interpret a completed pie chart, and then answer questions...
Curated OER
Statistics and Probablility
Statistics and Probability are all about collecting, organizing, and interpreting data. Young learners use previously collected data and construct a picture graph of the data on poster board. This stellar lesson should lead to...
Bowland
Alien Invasion
Win the war of the worlds! Scholars solve a variety of problems related to an alien invasion. They determine where spaceships have landed on a coordinate map, devise a plan to avoid the aliens, observe the aliens, and break a code to...
Science 4 Inquiry
Snakes in the Everglades
The Burmese python is on the loose ... and he's hungry! Illustrate the differences between causative and correlative relationships through an inquiry lesson. Pupils examine several sources of information to determine if there is a...
Illustrative Mathematics
Writing Constraints
Use this resource to present your number crunchers with how to write a constraint equation and to determine viable solutions. The price of an object limits the amount that can be purchased. The speed at which you walk limits the number...
Science 4 Inquiry
The Ups and Downs of Populations
Life has its ups and downs ... especially if you're an animal! Biology scholars engage in a population study through an inquiry-based lesson. Pupils work together to explore the factors that affect deer populations, then examine the...
Rainforest Alliance
Forests of Guatemala
With 90 percent of its land area covered in forests, Suriname, a country in South America, contains the largest percentage of forests throughout the world. Here is an activity that brings classmates together to learn about the...
Curated OER
Let's Plot Points
Use coordinate grid paper to plot points and identify shapes that are already plotted on the paper by saying their coordinates. Pupils also measure the distance between points and play the game Battleship. There are several web links and...
Laying the Foundation
Box-and-Whisker Plots
Statistics is made approachable, and dare we say fun, in this activity on using box-and-whisker plots to analyze and compare data sets. Specific emphasis is placed on interpretations and explanations while graphing, and in using the...
Curated OER
Slope
Studying slope? This one page worksheet has it covered! Learners use graphs and coordinates to find slope and also use slope to find a missing coordinate of a point on a line. The lesson also includes a real-world example that asks...
Howard Hughes Medical Institute
Population Genetics, Selection, and Evolution
The Hardy-Weinberg principle states that alleles and genotypes remain constant in the absence of evolutionary influences. Scholars complete a simple hands-on activity applying the Hardy-Weinberg principle to sample data. They observe how...
Curated OER
Rates of Chemical Reactions-The Iodine Clock Reaction
Learners investigate the reaction rate of iodine and soluble starch. In this rates of chemical reactions lesson plan, students study the effects of varying concentrations of reactants and varying temperatures of reactants on the reaction...
Curated OER
Hyperbolas: Sketching from the Equation
In this algebra worksheet, students sketch graphs of hyperbolas after solving equations to standard form and interpreting the center, vertices, foci, axis, asymptotes, and eccentricity from the equation. There are 58 questions.
Curated OER
Weather, Sea Level Rise and Climate Change
Students differentiate weather and climate. For this earth science lesson, students compare weather and climate in different regions of the world. They interpret weather graphs and compare isotherm lines of northern and southern hemisphere.
NOAA
Subduction Zones
Sink into an interactive learning experience about subduction zones! Junior oceanographers examine the earth-shaking and earth-making effects of subduction in the fourth installment in a 13-part series. Hands-on activities include...
Other popular searches
- Interpret Graphs and Charts
- Read and Interpret Graphs
- Graphs Interpret
- Interpret Graphs Science
- Interpret Graphs and Data
- Use and Interpret Graphs
- Interpret Graphs and Science
- Algebra Interpret Graphs
- Graphs Interpret Plot


