Curated OER
Energy and Changes of State
Students complete a variety of labs to help them explain how energy affects the changes in states of matter. They also be required to collect and record data, graph data, and apply interpretations of that data.
Curated OER
Plant Nutrition and Nutrients
Students observe seeds growth and examine the different parts of the seedling. In this biology lesson, students compare the growth of seeds planted in soil and in hydroponics. They record their observations in their science journal and...
Curated OER
Gaia: The Wisdom of the Earth
Learners are introduced to Gaia theory of natural homeostasis. They graph Earth's temperatures over time, construct terrariums or monitor the outdoor environment. Related videos titles are suggested, but may be outdated. The objectives...
Curated OER
Investigating Motion, Forces, and Energy Lab Book
Eighth graders create their own experiements using toy trucks, cars or balls to measure the time it takes two of them to travel 5 meters, as well as at each 1 meter interval. They make use computers to make a time/distance graph and...
Curated OER
Exploring Wyoming Species Habitats
Students are introduced to the concept of species habitats and ranges. They introduced to ArcView GIS as a tool for mapping. Pupils use query data for species withina county, elevation, range, rivers and streams, land cover, and etc....
Alabama Learning Exchange
Graphing Stations
Students explore the concept of graphing stations. In this graphing stations lesson, students head to various teacher set-up stations involving slope, point-slope, standard form, parallel lines, etc. Students work problems at...
Curated OER
Graphing Population Around the World
Students define specific vocabulary necessary for understanding population data. They collect, analyze, and interpret specific data. They utilize computer programs in order to create graphs of collected data.
Curated OER
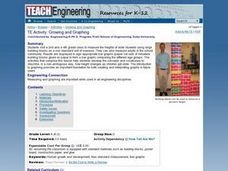
Growing and Graphing
Students visit a 2nd and a 4th grade class to measure the heights of older students using large building blocks as a non-standard unit of measure. They can also measure adults in the school community. Results are displayed in...
Alabama Learning Exchange
We Love to Graph!
Students experience graphing points. For this graphing points lesson, students play an on-line game where they must name 10 coordinate pairs correctly. Students play a maze game where they maneuver a robot using coordinate...
Curated OER
Computer Graphing
Students research the Internet or create surveys to find graphable data. They collect, organize, analyze and interpret the data. Finally, they choose the appropriate type of graph to display the data and find the measures of central...
Curated OER
Forest Activity: Interpreting a Graph
Pupils research forest growth online. They analyze the parts and contents of a graph, then summarize in narrative form the changes in the forest over time.
Curated OER
Graphing and Analysis of Water Quality Reports
Students practice making graphs and interpreting them. They compare and contrast different sets of data. They use Microsoft Excel to create different types of graphs.
Curated OER
Graphing the Elephant Seal Population Data
Students are able to graph data that they generated in the elephant seal exercise using proper format and labeling. They are able to interpret the graphs they created and make A) conclusions, and B) predictions based on that graph.
Curated OER
Graphing Data - Temperature
Seventh graders measure and record temperature over a given time period. They compare the recorded temperatures to the 40-year recorded normal average temperatures for the same area. Students display and interpret their findings in a graph.
Curated OER
Creating and Analyzing Graphs of Tropospheric Ozone
Students create and analyze graphs using archived atmospheric data to compare the ozone levels of selected regions around the world.
Curated OER
Graphing Speed
Students use LOGAL motion detector probe and observe a generated graph as a student performs various standard motions, and make measurements of time and distance. They suggest various time and distance measurements which a student can...
Curated OER
Introduction to Science
Seventh graders investigate scientific methods to solve problems. They demonstrate creating data tables and graphs. They study the role of a scientist and the importance of safety in a science lab. They distinguish between an...
Curated OER
Calculating & Graphing Using a Spreadsheet
Students use the lab apparatus to calculate the average velocity and average acceleration at several points and record the data. They use the spreadsheets to plot distance vs. time, velocity vs. time and acceleration vs. time graphs.
Curated OER
3-D Beginning Graphs
Students explore the concept of big and small. They collect objects from the classroom, sort them by size, and create a graph using Duplo stacking blocks.
Curated OER
Science: Trouble in the Troposphere
Students research a NASA Website and record information about an assigned city's tropospheric ozone residual monthly climate. In groups, they graph the information for the past year. They form new groups and compare their city's...
Curated OER
Volcano Spreadsheet and Graph
Fourth graders find the height of selected volcanoes and convert their measurements to feet. Students interpret information from a graph. They also write math questions that require the use of a class created graph. Students use a...
National Academy of Sciences
Lights at Night Webquest
Help learners find ways to become more efficient energy consumers. To start, individuals research how different countries address energy efficiency and then analyze their own carbon footprint. They use their research to identify ways to...
Consortium for Ocean Science Exploration and Engagement (COSEE)
Climate Change Impacts on Blue King Crabs
Carbon dioxide is not only causing global temperatures to increase, it causes the oceans to become more acidic. Lesson focuses on the blue king crab and the fragility of the habitat due to climate change. Scholars create a concept map...
Curated OER
Climographs
Learners identify trends and characteristics of climate zones and specific places within. Then, they graph annual climate trends (primarily Temperature and Precipitation) and create, interpret and extrapolate information based on...

