Curated OER
Mapping the Aegean Seafloor
Earth science learners create a two-dimensional topographic map of the floor of the Aegean Sea. They use it to then create a three-dimensional model of the ocean floor features. This comprehensive resource delivers strong background...
Curated OER
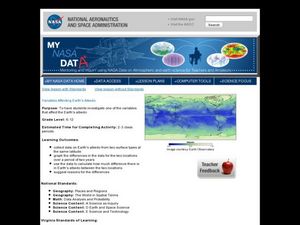
Variables Affecting Earth's Albedo
Students study the variables that affect the Earth's albedo. In this environmental data analysis lesson students interpret and graph information and calculate changes.
Curated OER
Exploring Wyoming Species Habitats
Middle schoolers are introduced to the concept of species habitats and ranges. They introduced to ArcView GIS as a tool for mapping. Pupils use query data for species withina county, elevation, range, rivers and streams, land cover, and...
Curated OER
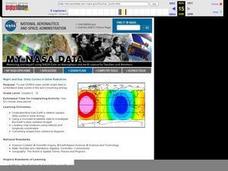
NIGHT AND DAY: DAILY CYCLES IN SOLAR RADIATION
Students examine how Earth's rotation causes daily cycles in solar energy using a microset of satellite data to investigate the Earth's daily radiation budget and locating map locations using latitude and longitude coordinates.
Curated OER
Trends of Snow Cover and Temperature in Alaska
High schoolers gather historical snow cover and temperature data from the MY NASA DATA Web site. They compare this data to data gathered using ground measurements from the ALISON Web site for Shageluk Lake. They graph both sets of data...
Curated OER
Mapping River Statistics
Students research different statistics to do with the Mississippi River. They answer questions about finding data and collect it by conducting research. The research is used to construct a data table. Then students use the table to...
Curated OER
You Be The Census Taker
Learners interpret information from an excerpt of the 1870 U.S. Census and compare that data to economic data they collect about local businesses in their own community. Students then evaluate how closely linked their community's economy...
Curated OER
200 Years and Counting: How the U.S. Census Tracks Social Trends
Students examine the process of census taking in the United States. In this "200 Years and Counting" instructional activity, students examine the data collection process, look at an example of a census form, analyze data, and learn what...
Curated OER
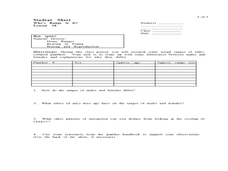
Who's Range is it?
Students investigate the habits of panthers by analyzing radio transmitted data. In this animal life lesson plan, students utilize computers to view the range of different statistics dealing with Florida panthers. Students complete a...
Curated OER
Using Maps to Make Public Health Descisions Case Study: Harmful Algal Blooms in the Gulf of Mexico
Learners are introduced to GIS and its uses. Students participate as public health scientists to deliberate a course of action to explore possible research questions. Pupils interpret spatial data, and make predictions based on GIS data,...
Curated OER
Local Traffic Survey
Students conduct a traffic survey and interpret their data and use graphs and charts to display their results.
Curated OER
Fossil Fuels (Part II), The Geology of Oil
More of a mini-unit than a lesson, these activities lead inquisitors through a survey of oil deposits. In the first part, they read about and view diagrams of sedimentary rock layers that trap oil. Next, they test porosity and...
Curated OER
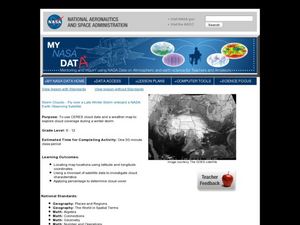
Storm Clouds-- Fly over a Late Winter Storm onboard a NASA Earth Observing Satellite
Students study cloud data and weather maps to explore cloud activity. In this cloud data lesson students locate latitude and longitude coordinates and determine cloud cover percentages.
Curated OER
Think GREEN - Utilizing Renewable Solar Energy
Students use data to find the best renewable energy potential. In this solar energy lesson students import data into Excel and explain how solar energy is beneficial.
Curated OER
Using My Nasa Data To Determine Volcanic Activity
Students use NASA satellite data of optical depth as a tool to determine volcanic activity on Reunion Island during 2000-2001. They access the data and utilize Excel to create a graph that has optical depth as a function of time for the...
Curated OER
Exploring the USA and the World with Cartograms
Young scholars investigate cartograms in order to explore the different countries on Earth. In this world geography lesson, students use the Internet to analyze data on different cartograms. Young scholars compare data, such as...
Curated OER
Mapping Exercise
In this mapping worksheet, students are given data of children exposed to health risks and their geographical location. Students plot each child's home and the risk factors using an (x, y) grid. They answer 2 questions about the...
Curated OER
Mapping the Ocean Floor
Students construct and interpret a line graph of ocean floor depth and a bar graph comparing the height/depth of several well-known natural and man-made objects and places. In addition, they calculate the depth of two points using sonar...
Curated OER
Virtual Field Trip
This hands-on resource has future trip planners analyze graphs of mileage, gasoline costs, and travel time on different routes. While this was originally designed for a problem-solving exercise using a Michigan map, it could be used as a...
Curated OER
Climographs
Students identify trends and characteristics of climate zones and specific places within. Then, they graph annual climate trends (primarily Temperature and Precipitation) and create, interpret and extrapolate information based on...
NOAA
A Watery World
With about 70% of the earth's surface covered in oceans, it's fair to say that we live in a very wet world. Young scientists gain a better appreciation of this fact as they use maps to identify the world's ocean basins in the first...
NASA
Cloudy vs. Clear - Graphs
Explore the link between solar energy and cloud cover using real data from NASA from China! Future climatologists analyze and interpret graphs of solar energy on clear and cloudy days using a literacy cube. Investigators draw conclusions...
Curated OER
Where Should We Put a Store?
Students analyze population data. They convert population data into simple density maps to help make decisions about their world. They select the best location for a school store based on population density. They present their maps...
Curated OER
Maps
Students investigate three types of maps. In this history lesson, students idenitfy different maps and explore how they relate to the area, while keeping climate and topography in mind. They discuss maps used to navigate land. air and sea.


