Hi, what do you want to do?
Centre for Innovation in Mathematics Teaching
Ten Data Analysis Activities
This thirteen page data analysis worksheet contains a number of interesting problems regarding statistics. The activities cover the concepts of average measurements, standard deviation, box and whisker plots, quartiles, frequency...
National Council of Teachers of Mathematics
Eruptions: Old Faithful Geyser
How long do we have to wait? Given several days of times between eruptions of Old Faithful, learners create a graphical representation for two days. Groups combine their data to determine an appropriate wait time between eruptions.
PBL Pathways
College Costs 2
What is the financial benefit for attending a community college for the first two years before transferring to a four-year college? The second part of the educational lesson asks young scholars to explore this question through data...
Curated OER
Button Bonanza
Collections of data represented in stem and leaf plots are organized by young statisticians as they embark some math engaging activities.
Curated OER
Prescient Grading
Do homework grades really determine test scores? Learn whether lines of best fit, correlation coefficients, and residuals can be used to determine test scores when given homework grades. (It would certainly save teachers time in grading...
Illustrative Mathematics
Puzzle Times
Give your mathematicians this set of data and have them create a dot plot, then find mean and median. They are asked to question the values of the mean and median and decide why they are not equal. Have learners write their answers or...
US Department of Commerce
Educational Attainment and Marriage Age - Testing a Correlation Coefficient's Significance
Do women with college degrees get married later? Using a provided scatter plot of the percentage of women who earn bachelor's degrees and the median age at which women first get married over time, pupils conduct a linear regression...
Curated OER
Animal Brains
Do big bodies make big brains? Let your learners decide whether there is an association between body weight and brain weight by putting the data from different animals into a scatterplot. They can remove any outliers and then make a line...
Teach Engineering
Using Hooke's Law to Understand Materials
Provide a Hooke for a lesson on elasticity with an activity that has groups investigate a set of springs. They use a set procedure to collect data to calculate the spring constant for each spring using Hooke's Law. The groups...
PBL Pathways
Students and Teachers
Predict the future of education through a mathematical analysis. Using a project-based learning strategy, classes examine the pattern of student-to-teacher ratios over a period of years. Provided with the relevant data, learners create a...
PBL Pathways
College Costs
Predict the year that college costs will double in your state using linear modeling. The first part of this two-part project based learning activity asks young mathematicians to use data from the College Board. They graph the data,...
DiscoverE
LIDAR: Mapping with Lasers
We would be lost without maps! How are they made? Introduce junior topographers to LIDAR technology with a fascinating activity. Set up a mock city, then have learners operate a laser measure to determine the shape of the landscape using...
Wake Forest University
Authentic Activities for Connecting Mathematics to the Real World
Check out the handout from a presentation that contains a collection of high school algebra projects connecting a variety of mathematics to the real world. Activities range from simple probabilities to calculus. The activities...
Texas State Energy Conservation Office
Investigation: Kinetic and Potential Energy
A well-developed lab sheet guides physical science learners through an investigation of kinetic and potential energy. In small groups, collaborators discover whether or not the ramp height or mass of an object has an effect on the...
Discovery Education
Cool It!
Adjust the melting time of ice without varying the temperature! Learners experiment with different materials to decide how the materials affect the rate an ice cube melts. They then connect their findings to the conductivity of each...
Illustrative Mathematics
Paying the Rent
Learning how a bank account works is a useful tool. The exercise in the resource is to deduct rent from a checking account and create an equation from a description. Participants then graph the balance of the bank account versus months...
Math Is Fun
Math Is Fun: Data Graphs
Create and customize a bar graph, line graph, or pie chart based on a set of data and print it out.
Beacon Learning Center
Beacon Learning Center: Push Ups
This is a tutorial on line graphs including when, how, and why one might choose to use them and how to interpret the data when it is complete. This one is to reach a goal for the number of push ups needed to win the Presidential Fitness...
Science Education Resource Center at Carleton College
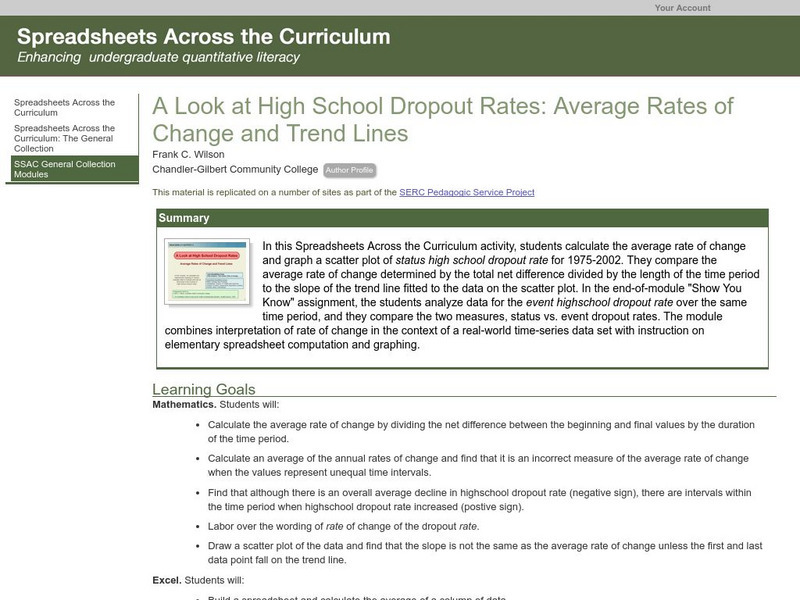
Serc: Average Rates of Change and Trend Lines
In this Spreadsheets Across the Curriculum activity, students calculate the average rate of change and graph a scatter plot of status high school dropout rate for 1975-2002. The module combines interpretation of rate of change in the...
Texas Instruments
Texas Instruments: Tight Rope
In this activity, students examine quantities that are linearly related and can be visually represented using a straight-line graph. Students collect distance versus time data using a motion detector and find a model for the...
Texas Instruments
Texas Instruments: An Exploration of Direct Variation and Linear Regression
Students will use this activity for the following Algebra concepts: Review of Direct Variation; Properties of direct variations; Finding the constant of variations from data sets; Find missing values in data sets both numerically and...
TeachEngineering
Teach Engineering: Forces and Graphing
This activity can be used to explore forces acting on an object, to practice graphing experimental data, and/or to introduce the algebra concepts of slope and intercept of a line. A wooden 2x4 beam is set on top of two scales. Students...
Texas Instruments
Texas Instruments: Numb3 Rs: Less Is More
Based off of the hit television show NUMB3RS, this two-part lesson begins by having students try to find the line of best fit for a given set of data (strike outs vs. home runs). The second part of the lesson shows how least squares...
Texas Instruments
Texas Instruments: Finding Linear Models
Students graph a scatter plot, find average rate of change, develop a linear model, find a linear regression and a median/median line for a set of data graphed in a scatter plot and predict profit.


