Curated OER
In the Billions and Linear Modeling
Your learners analyze population data to discern if it best fits a linear scenario. The idea of change by equal differences over equal intervals is enforced in this real-life task.
Curated OER
A Model Solar System
If Earth is modeled by a grapefruit, what planet could be represented by a golf ball? This activity uses everyday and not-so-everyday objects to create a model of the Solar System.
101 Questions
25 Billion Apps
Learn to use mathematics to your advantage! Using linear modeling, scholars predict the date and time the Apple App Store reaches 25 billion downloads. Considering the prize for the 25 billionth download was a $10,000 gift card, modeling...
Illustrative Mathematics
Modeling with a Linear Function
Here is a well-designed resource that provides five yes-or-no questions which model different situations with linear functions. It makes a good pre-test for the beginning of the unit. The purpose is to elicit common misconceptions of...
Curated OER
US Population 1982-1988
Your algebra learners make predictions using the concepts of a linear model from real-life data given in table form. Learners analyze and discuss solutions without having to write a linear equation.
101 Questions
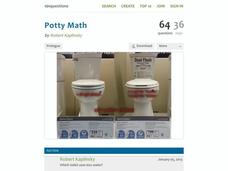
Potty Math
You don't want to flush your money down the drain! Have your classes complete a financial comparison between two different types of toilets. They use linear modeling to determine the most cost-effective model.
Curated OER
Linear or Exponential?
Your learners analyze various real-life contexts to decide if each is a linear or exponential model. This could be used as an assessment of learners' skills of discerning between a linear and an exponential model.
Illustrative Mathematics
Distance across the channel
Here you will find a model of a linear relationship between two quantities, the water depth of a channel and the distance across the channel at water level. The cross section of the channel is the shape of an isosceles trapezoid. The...
5280 Math
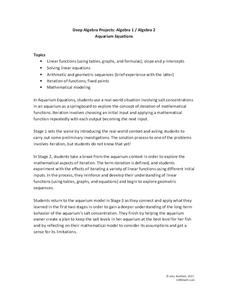
Aquarium Equations
Take a look at linear functions in a new environment. A three-stage algebra project first asks learners to model the salt concentration of an aquarium using linear functions. Then, using iterations, pupils create a set of input-output...
Howard County Schools
To Babysit or Not to Babysit?
Would you work for a penny today? Use this activity to highlight the pattern of increase in an exponential function. Scholars compare two options of being paid: one linear and one exponential. Depending on the number of days worked, they...
Curated OER
Heart Rate Monitoring
Algebra learners like this resource because it is easy to understand and it relates to their lives. Whether you are starting a new workout routine, or just climbing the stairs, your heart rate increases and decreases throughout the day....
101 Questions
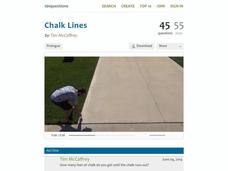
Chalk Lines
Read between the lines to find a solution. Budding mathematicians analyze a situation to solve a problem. They view a video presentation of the problem, brainstorm important information to gather, and write linear equations to find...
PBL Pathways
College Costs 2
What is the financial benefit for attending a community college for the first two years before transferring to a four-year college? The second part of the educational lesson asks young scholars to explore this question through data...
PBL Pathways
College Costs
Predict the year that college costs will double in your state using linear modeling. The first part of this two-part project based learning activity asks young mathematicians to use data from the College Board. They graph the data,...
Illustrative Mathematics
Downhill
A car traveling down a steep hill is the model for this resource. The confusion comes when the elevation, E, is given in terms of distance, d. The distance, d, is the horizontal distance from E. Therefore, the equation, E = 7500 – 250d,...
Illustrative Mathematics
Delivering the Mail
A mail truck travels the same amount of miles per day. It will be up to your algebra learners to find an equation for this mailman’s truck. One needs a good understanding of rate of change and the initial value for this model. The...
Curated OER
US Airports, Assessment Variation
Determining relationships is all part of algebra and functions. Your mathematicians will decide the type of relationship between airports and population and translate what the slope and y-intercept represent. The problem is multiple...
Curated OER
Logistic Growth Model, Explicit Version
Via the concrete setting of estimating the population of the US, your algebra learners are introduced to a logistic growth model. Comparing and contrasting logistic, exponential, linear and quadratic models, to see which fits the data...
Curated OER
US Households
Learners construct and use inverse functions to model a real-world context. They use the inverse function to interpolate a data point.
Curated OER
Quinoa Pasta 2
Learners discover that a system of linear equations models this mixture of quinoa and corn in a collaborative task. Your learners receive all the relevant information in this second of three variants of tasks that ask them to find...
Illustrative Mathematics
Chicken and Steak, Variation 2
Many organizations put on barbecues in order to make money. In a real-world math problem, the money allotted to purchase steak and chicken at this barbecue is only one hundred dollars. It is up to your potential chefs to figure out how...
Curated OER
Equal Differences Over Equal Intervals 1
Learners explore linear functions concretely using tables of values in a cooperative task. The concept of the values of linear functions changing by equal differences over equal intervals of one is emphasized. Learners will discover...
Illustrative Mathematics
The Sign of Solutions
Positive or negative, zero or no solution, are all possibilities for the solution of a linear equation. Here the resource gives examples of linear equations in one variable and their type of solutions. The resource comes with commentary...
Illustrative Mathematics
Fixing the Furnace
This comprehensive resource applies simultaneous equations to a real-life problem. Though the commentary starts with a graph, some home consumers may choose to begin with a table. A graph does aid learners to visualize the shift of one...


