Curated OER
Linear Motion
Students are able to build an understanding of linear motion. They are able to define and calculate the speed and acceleration of various objects. Students are able to differentiate betweeen instantaneous speed and average speed. They...
Curated OER
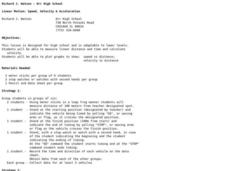
Linear Motion: Speed, Velocity & Acceleration
Students explore the concept of linear motion. In this linear motion lesson, students calculate distance and time in order to calculate average speed and velocity in the provided problems.
West Contra Costa Unified School District
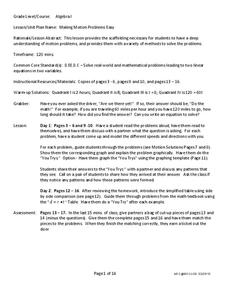
Motion Problems
Let's hope class participants don't get motion sickness. In the lesson, class members first solve motion problems using tables and graphs. They then use algebraic techniques to solve motion problems.
Virginia Department of Education
Linear Modeling
An inquiry-based algebra lesson explores real-world applications of linear functions. Scholars investigate four different situations that can be modeled by linear functions, identifying the rate of change, as well as the...
EngageNY
Graphing Quadratic Functions from Factored Form
How do you graph a quadratic function efficiently? Explore graphing quadratic functions by writing in intercept form with a instructional activity that makes a strong connection to the symmetry of the graph and its key features before...
EngageNY
Graphs of Quadratic Functions
How high is too high for a belly flop? Learners analyze data to model the world record belly flop using a quadratic equation. They create a graph and analyze the key features and apply them to the context of the video.
EngageNY
Graphs of Piecewise Linear Functions
Everybody loves video day! Grab your class's attention with this well-designed and engaging resource about graphing. The video introduces a scenario that will be graphed with a piecewise function, then makes a connection to domain...
Teach Engineering
Applications of Linear Functions
It's not so straightforward — lines can model a variety of applications. Pupils experience linear relationships within the context of science, including Hooke's and Ohm's Laws. Class members got a taste of motion and speed from the...
Curated OER
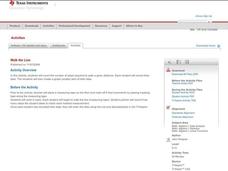
Walk the Line
Learners create constant speed versus motion graphs. They will perform linear regressions on their data to describe the graphs mathematically.
EngageNY
Modeling with Quadratic Functions (part 2)
How many points are needed to define a unique parabola? Individuals work with data to answer this question. Ultimately, they determine the quadratic model when given three points. The concept is applied to data from a dropped...
Curated OER
Connections Involving Linear And Quadratic Functions
In this math worksheet, pupils determine the range of the function. Then they graph the functions while finding the coordinates on the plane.
Curated OER
Linear Functions
Students solve and graph linear equations. In this algebra lesson, students collect data and plot it to create a linear function. They identify the domain and range of each line.
Curated OER
Linear Functions-Learn Your Lines
Students solve and graph linear equations. In this algebra instructional activity, students collect and plot data on a coordinate plane. They use the CBL and TI calculator to graph systems of equation.
Curated OER
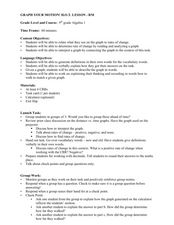
Graph Your Motion
Students graph their linear equations. In this algebra lesson, students examine their lines and relate it to the slope or rate of change. They relate the steepness of the line to the slope being positive, negative or zero.
Curated OER
Building Understanding of Rate of Change/Slopes Using Alice
Students explore slope as a rate of change. In this eighth grade mathematics lesson plan, students investigate real-world problems to determine rate of change and transform it into a linear representation, thus determining slope....
Texas Instruments
Let's Play Ball with Families of Graphs
Learners explore quadratic equations in this Algebra II lesson. They investigate families of quadratic functions by graphing the parent function and family members on the same graph. Additionally, they write the equation of the parabola...
Curated OER
Another Way of Factoring
Focusing on this algebra instructional activity, learners relate quadratic equations in factored form to their solutions and their graph from a number of different aspects. In some problems, one starts with the original equation and...
Curated OER
Walking Home II
Students explore the relationship between distance and time. They analyze a situation involving distance traveled in a given period of time, represent the situation graphically and algebraically, and discuss the concept of slope as a...
EngageNY
The Height and Co-Height Functions of a Ferris Wheel
Show learners the power of mathematics as they model real-life designs. Pupils graph a periodic function by comparing the degree of rotation to the height of a ferris wheel.
Curated OER
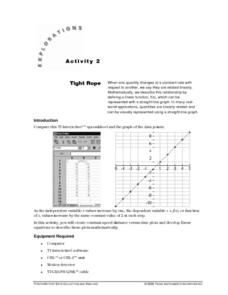
Tight Rope
Learn how to explore the concept of linear functions. In this linear functions lesson, high schoolers collect linear data from a motion detector. Students walk to create a linear function. High schoolers plot the points...
Curated OER
Mathematical Techniques - Basic Graphing
Students are introduced to significant figures and how to add, subtract, multiply and divide them. In a group, they practice plotting data points from a table to a graph and labeling all axes. They calculate the slope and y-intercept and...
EngageNY
Motion Along a Line – Search Robots Again
We can mathematically model the path of a robot. Learners use parametric equations to find the location of a robot at a given time. They compare the paths of multiple robots looking for parallel and perpendicular relationships and...
Curated OER
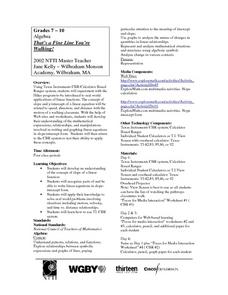
That's a Fine Line You're Walking!
Learners experiment with Hiker program to practice real world applications of linear functions and develop their understanding of expressions, relationships, and manipulations involved in writing and graphing linear equations in...
Curated OER
Move It
Studens collect and graph data. In this algebra lesson, students use a CBL and CBR with a TI Calcualtor to observe linear graphs. They use the correct vocabualry as they discuss the collected data.
