Curated OER
Reading Graphs
Encourage kids to read line graphs with confidence using these examples and accompanying comprehension questions. Learners examine two graphs and answer four questions about each. This is definitely intended for beginners to this type of...
Curated OER
Using Vegetation, Precipitation, and Surface Temperature to Study Climate Zones
Using NASA's Live Access Server, earth scientists compare the temperature, precipitation, and normalized difference vegetation index for four different locations. They use the data to identify the climate zone of each location using...
Chicago Botanic Garden
Climate Change Impacts on Ecosystem Services
The fourth activity in a series of five has classes participate in a jigsaw to learn about global impacts of climate change and then share their new information with a home group. Groups then research impacts of climate change (droughts,...
Curated OER
Surface Meteorological Observation System (SMOS)
Students monitor local surface weather conditions for at least 30 days. They interpret the data by graphing it and detemining percentages.
Curated OER
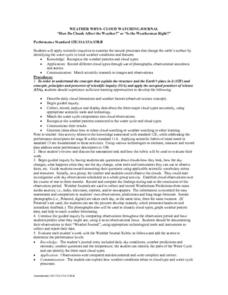
Weather Whys- Cloud Watching Journal
Pupils examine how natural processes change the earth by identifying their local water cycle. Individual students complete a cloud journal over a specific period of time. They observe clouds daily and take photographs of the clouds...
Curated OER
Checking Weather Forecasts
Students record a four or five day weather forecast. They check the actual weather and compare it with the forecast.
Curated OER
ESOL Environment and the World
Students examine vocabulary cards with pictures of each season and weather terms. They answer a series of questions regarding the weather using the correct vocabulary. They use magazines and newspapers to find pictures and activities...
Curated OER
Highs and Lows
Students use email to chart weather patterns and then graph their findings. In this weather patterns instructional activity, students chart their weather for a week at the school. Students then use email to find temperatures at a variety...
Curated OER
What Makes a House a House
Students examine the ways in which the environment influences the house design. They describe how the physical environment, weather and local materials influence the type of house a family builds. They draw a house according to a given...
Curated OER
What Will I Wear to School Today?
Pupils describe the day's weather and observe their responses as they are written on the board. They brainstorm all different types of weather and how differences in weather determine what types of clothing we wear to school each day....
Curated OER
Becoming a Meteorologist
Students identify the job of a meteorologist. In this meteorologist lesson, students read Cloudy with a Chance of Meatballs and view clips of weather forecasts. Students visit the Weather Channel website and sing a weather song. Students...
Curated OER
Predicting Temperature: An Internet/Excel Learning Experience
Third graders use the Internet (www.weather.com) to find the high temperature for our locale and the high temperature for another city around the world. They keep track of the temperature in these two locations for 10 days.
Curated OER
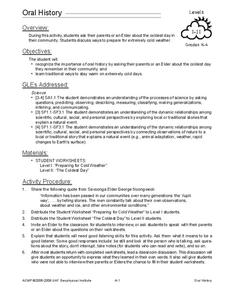
Oral History
Students interview a Native Elder to learn about oral history and cold weather. In this weather lesson, students ask an Elder about the coldest day they remember in their community and complete two worksheets for the topic.
Curated OER
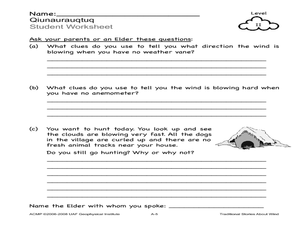
Traditional Stories about Wind
Students observe and talk about wind using no weather instruments. In this wind lesson plan, students use their senses to observe wind. They also interview an Elder about wind.
Curated OER
Decision Making
Young scholars study weather patterns and learn to make decisions based on the weather. In this weather lesson, students plan a potluck based on the weather. Young scholars use a decision tree to brainstorm about the activity. Students...
Curated OER
Meteorology
Fourth graders study how atmospheric conditions change while naming the things that make the weather change. They investigate the affects of air masses, weather fronts and high/low pressure by looking at weather maps from newspapers.
Curated OER
What is Wind Chill?
Students calculate wind chill using a mathematical formula. In this earth science lesson, students compare the wind chill in Antarctica to that of their local area. They explain how this can lead to hypothermia.
Curated OER
Outdoor Observation
Second graders explore Earth science by participating in a nature observation activity. In this four seasons lesson, 2nd graders identify the four seasons on Earth and the weather patterns they are known for. Students read several books...
Curated OER
It's Getting Hot out Here! Should I be concerned? (Climate Change)
Students explore the effects of global warming. They examine the differences between weather and climate. After viewing a video, students summarize information on climate change and drought.
Curated OER
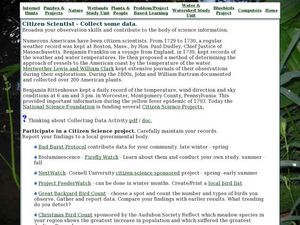
Citizen Scientist - Collect Some Data
In this science project activity, students view a sheet of numerous science projects including weather, animals, flowers, and more. Students choose 1 project to do out of 22 projects total.
Alabama Learning Exchange
Tornadoes
Young scholars research tornadoes. For this weather instructional activity, students construct a KWL chart on tornadoes and view the video National Geographic-Tornadoes. Young scholars discuss the facts they learned from the film and...
Curated OER
Wet-Dry Bulb Hygrometers: Measuring Relative Humidity and Apparent Temperature
Students work in groups of 4 for the activity/activity part of this exercise. They know that clouds are formed by the condensation of water vapor, affect weather and climate. Also that global patterns of atmospheric movement influence...
Curated OER
Pollute Locally, Spread It Globally
Students examine the rate of pollution throughout the world through an interactive program. They define air quality and the air quality index. They examine fuel economy and its impact on the Earth and renewable and nonrenewable resources.
Curated OER
Graphics Creation and Statistical Interpretation: Relating Local Economics and the Global Environment
Students apply statistics, and graphical interpretation to economics, the environment and populations. In this statistical lesson students construct graphical displays and classify data.
Other popular searches
- Local Weather Forecasts
- Local Weather Unit
- Local Weather Graph
- Local Weather Concepts
- Local Weather Line Graph


