Curated OER
1492: Using Data to Explain a Journey
Young scholars examine how Christopher Columbus made his way across the Atlantic. In this data instructional activity students use an Internet program to navigate like Columbus.
Curated OER
Holocaust Map Studies
Learners analyze maps and answer discussion questions related to WWI. In this geography lesson, students analyze historic maps to determine causes and effects of WWI in Europe. Learners read testimonies of Holocaust survivors and label...
Curated OER
Cold, Clouds, and Snowflakes
Students explore satellite data and graphing. In this weather data analysis math and science lesson, students analyze NASA satellite data to draw conclusions about geographical areas where precipitation might have happened. Students...
Curated OER
Finding Your Way Around the World
Students plan a trip around the world and create a PowerPoint presentation of the journey. In this map, atlas, and technology lesson, students plan a trip around the world in which they avoid using an airplane. Students will consider...
National Endowment for the Humanities
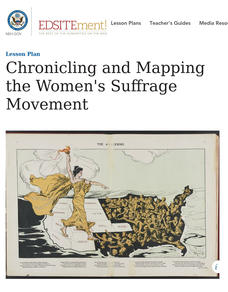
Chronicling and Mapping the Women's Suffrage Movement
While women's suffrage is often believed to be the result of a single constitutional amendment, the effort of women to secure the vote spanned decades and continents. Using primary sources in online archives, class members explore the...
Curated OER
Mapping the Census
Students learn why the census makes a difference. In this U.S. Census lesson plan, students learn the key elements of cartography, examine the difference between data and their representation, and create a map using census data.
Curated OER
The Weather Page-Comparing Data
Learners examine weather patterns in the United States. In this weather lesson, students use a United States map to identify high and low temperatures in two states. Learners compare the data and record their findings onto a chart.
Curated OER
Using Old Maps as Tools to Explore Our World
Students explore historical maps. In this primary source analysis lesson, students uncover the meanings in selected historical maps as they use them to enhance lessons on historical events. Samples for classroom use are provided in this...
Curated OER
These Maps are for the Birds
Learners identify and study New York State Breeding Bird Atlas maps to learn where different bird species nest and how their distributions have changed over time. They also identify how maps serve as representations of a geographic...
Curated OER
Weather, Data, Graphs and Maps
Students collect data on the weather, graph and analyze it. In this algebra lesson, students interpret maps and are able to better plan their days based on the weather reading. They make predictions based on the type of clouds they see.
Curated OER
Interpreting Data and Building Hypothesis
Learners define the term species, and graph species data together with previously collected data at the National Zoo. They interpret graphed data and recognize patterns in the streamside quadrant versus hillside quadrant. Students use...
Curated OER
Charts, Maps, and Graphs Lesson on the Holocaust
High schoolers practice interpreting data. In this Holocaust lesson, students research selected Internet sources and examine charts, maps, and graphs regarding the Jewish populations in and out of Europe. High schoolers respond to...
Curated OER
But Where Is It On This Modern Map? A problem-solving, mind-boggling experience!
Trace Columbus' voyages by locating them on 21st Century maps. Using a navigators lesson, 4th graders will examine the Age of Exploration and trace Columbus's routes accurately on laminated world maps using different maps. Note: You...
Curated OER
Important Decisions Don't Just Happen! Using Data to Plan Your Services
Young scholars interpret statistics. In this data lesson, students examine and organize given data. They present the data in a grid format. Using the census data, young scholars determine the best location for a local business.
Curated OER
Maps
Students investigate three types of maps. In this history lesson, students idenitfy different maps and explore how they relate to the area, while keeping climate and topography in mind. They discuss maps used to navigate land. air and sea.
Curated OER
Mapping the Canyon
Students compare and contrast topographic maps and bathymetric maps. They investigate how bathymetric maps are made and how to interpret one.
Curated OER
Create A Park Map
Students design ultimate park experience for Florida families as they demonstrate their knowledge of map legend skills.
Curated OER
Map Skills
Students create two types of maps. In this map skills lesson, students discuss map vocabulary and view maps of Florida. Students draw a free hand map of Florida and include major cities, bodies of water and land forms. Students work...
Baylor College
Mapping the Spread of HIV/AIDS
Where is HIV/AIDS most prevalent and what are the current trends regarding HIV? Have groups work together to map the world's HIV/AIDS rates, then create a class map with all the data. Lesson includes cross-disciplinary concepts including...
Curated OER
Great Lakes Homepage for Kids
Here are some outstanding lessons on the geology and history of the Great Lakes. These lessons are divided into Grade 4 -6, and Grade 7 - 8 activities. The activities all use the background information, maps, graphs, data, and Great...
Curated OER
Mapping Where Animals Live
What type of reptiles live in New York State? This instructional activity gets the class thinking about what factors determine where particular animals live. They analyze the Hudson Valley environment, identify specific reptile and...
NET Foundation for Television
1850-1874 Railroads and Settlement
Have you ever wondered how your town was placed where it is? Scholars research the impact the advancement of the railroad due to the passage of the Kansas-Nebraska Act had on the formation of civilization in the Great Plains. Map...
Curated OER
Representing Data 1: Using Frequency Graphs
Here is a instructional activity that focuses on the use of frequency graphs to identify a range of measures and makes sense of data in a real-world context as well as constructing frequency graphs given information about the mean,...
Polar Trec
Mini-Ocean Bathymetric Mapping Research Cruise
Middle or high schoolers transform into oceanographers in a week-long simulation. To begin, each group follows directions to create a model of the ocean floor with specified features. Next, the groups prepare to set sail on a research...
Other popular searches
- Weather Map Analysis
- Gis Data Map
- Gus Data Map
- Map Data Layer
- Interpreting Map Data
- Interpret Ting Map Data
- Interpretting Map Data
- Gs Data Map


