CK-12 Foundation
Venn Diagrams: Planets and Dwarf Planets of the Solar System
Yes, Venn diagrams are helpful in science, too. Learners use an interactive to classify celestial bodies as having moons, as dwarf plants, as both, or as neither. They answer a set of challenge questions based on the Venn diagrams they...
National Science Teachers Association
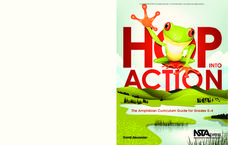
Hop into Action
Young scientists find out what makes amphibians such unique and interesting animals in this simple life science lesson. After looking at pictures and discussing the characteristics of amphibians, learners complete a series of three Venn...
Curated OER
Venn Diagram
In this graphic organizer worksheet, students complete a Venn Diagram in which they analyze two categories that overlap. They place the similarities in the middle shared section. They list the differences in the outer areas.
Curated OER
Close Observation: Coins
Integrate math, science, and speaking/listening with a collaborative hands-on activity. Each group works with a single penny, examining it with the naked eye and recording observations. Repeat using magnifying glasses. Then repeat with a...
Curated OER
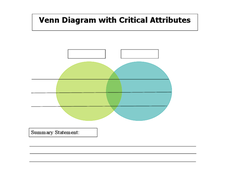
Venn Diagram with Critical Attributes
In this Venn diagram graphic organizer worksheet, students compare and contrast an item using the overlapping diagram. Students also list critical attributes in the space provided.
Curated OER
Graphing and Analyzing Biome Data
Students explore biome data. In this world geography and weather data analysis lesson, students record data about weather conditions in North Carolina, Las Vegas, and Brazil. Students convert Fahrenheit degrees to Celsius degrees and use...
Curated OER
Triple Venn Diagram
In this graphic organizer page, student complete a triple Venn Diagram. There are no specific questions or directions given with this page.
Curated OER
Making Predictions
Learners collect and classify items. In this making predictions instructional activity, students go outside and collect specimens of plants, insects and minerals. They classify each item and place them in a Venn Diagram. Learners...
Curated OER
Beef or Dairy?
Guernsey, Jersey, Holstein. Brangus, Charoloais, Herford. Here’s a truly cross-curricular resource that combines language arts, science, math, and visual arts activities as class members learn to distinguish between beef and dairy...
Curated OER
Beautiful Bovine
Looking for a fun and interactive way to explore bovine biology? Learners read a brief informational text (included for printing) before participating in several cross-curricular activities. First, grab their attention with a hilarious...
Curated OER
Everybody Needs a Rock
Students, after making quantitative and qualitative observations of their rocks, construct a Venn diagram or dichotomous key to classify their rocks.
Curated OER
It Started as an Egg
Learners investigate animals that hatch from eggs. In this hatching animals lesson plan, learners investigate which animals are born alive and which hatch from eggs. Learners read It Started As An Egg and practice reading comprehension...
Berkshire Museum
Reduce, Reuse, and Recycle: Sorting Through Personal Choices
Raise children's awareness about the importance of conservation with this hands-on science lesson. Start by breaking the class into groups and having them collect trash from around the school or local park. Students then use the provided...
Curated OER
Solar Storms-Fractions and Percentages
In this solar storms worksheet, students find the percentage of X-Flares and Halo CMEs that occurred in solar storms and complete a Venn Diagram comparing the numbers of each.
Curated OER
Solar Flares and Coronal Mass Ejections
In this solar flares and coronal mass ejections activity, students create a Venn Diagram with given data about solar flares and Halo CMEs. Students answer 6 questions about the events and the probability of each type of event occurring...
Curated OER
Solar Storms: Odds, Fractions and Percentages
In this solar storms activity, students read about the correlation between different astronomical events to find patters and new 'laws' of nature. Students use given statistical information about solar flares and coronal mass ejections...
Curated OER
Do Fast CMEs Produce Intense SPEs?
In this coronal mass ejections and Solar Proton Events worksheet, students create a Venn Diagram to represent given data. They answer 5 questions about the data related to the number of coronal mass ejections and Solar Proton Events...
Baylor College
Plant or Animal?
Teach your class about the necessities of life using the book Tillena Lou's Day in the Sun. After a teacher-read-aloud, students make puppets depicting different plants and animals from the story and illustrating the habitat in which...
Curated OER
What is Soil?
Third graders examine what makes soil by creating a Venn Diagram. In this Earth environment lesson, 3rd graders identify the different components that soil is made from. Students bring soil from their homes to examine and create a Venn...
Curated OER
The Role of Fire in Healthy Prairie, Brush and Forest Lands
Sixth graders read and discuss background information and brainstorm reasons for wildfires. They use a Venn Diagram to list the similarities and differences between wildfires and prescribed fires and then track the weather forecast for...
Curated OER
The Energy that Keeps Us Moving
Students measure the calorie content of food. In this technology lesson, students explore where the CEENBoTs get the energy to make it move. They create a Venn diagram showing the differences of energy in food and CEENBoTs.
University of Colorado
Are All Asteroids' Surfaces the Same Age?
Did you know scientists can tell the age of an asteroid by looking closely at its craters? This final lesson of a six-part series focuses on two asteroids, Gaspra and Ida, in order to demonstrate the concept of dating asteroids. Scholars...
Curated OER
Touch and Discover
Students identify the physical properties of items using the sense of touch. In this touch and discover lesson, students describe items. Students sort items using a Venn diagram.
Curated OER
Compare Human-made Objects with Natural Objects
Students examine and observe how many human-made objects get their basic design from things in nature. They listen to the book "Nature Got There First," compare/contrast hollow bones with drinking straws, bird beaks and tool pliers, and...
Other popular searches
- Venn Diagram Math
- Venn Diagram Math Worksheets
- Venn Diagrams Math
- Venn Diagrams in Math
- Graphing Math Venn Diagrams
- Sorting Math Venn Diagrams
- Venn Diagrams & Math
- Math Venn Diagrams Shape
- Venn Diagrams Math Fractions
- Sets Venn Diagrams Math
- Venn Diagram Math Drawing
- Math Venn Diagram Ms


