CK-12 Foundation
Mean: Harmonic Mean
Let the means live in harmony. With lengths representing the values of a small data set, learners compare the arithmetic mean to the harmonic mean. The pupils determine which value is the most accurate representation of the average of...
Shodor Education Foundation
Scatter Plot
What is the relationship between two variables? Groups work together to gather data on arm spans and height. Using the interactive, learners plot the bivariate data, labeling the axes and the graph. The resource allows scholars to create...
Corbett Maths
The Median
Find the one in the middle. An informative resource explains how to determine the median of a set of numbers. Using both even and odd numbers of data points, the video covers the process of finding the middle number. Worksheets provide...
College Board
2011 AP® Statistics Free-Response Questions
Familiarize yourself with the AP® exam by looking at past tests. A PDF file provides the 2011 AP® Statistics free-response questions. The questions include topics such as mean, standard deviation, conditional probability, sampling...
College Board
1998 AP® Statistics Free-Response Questions
Free-response questions form the 1998 AP® Statistics exam allow class members to analyze data from real-life situations. The situations include tracking defective parts, tracking butterflies, evaluating weed killers and determining...
College Board
2002 AP® Statistics Free-Response Questions Form B
Develop a deeper understanding of statistics. The six released free-response items from the 2002 AP® Statistics Form B involve several concepts that are currently in the regular statistics standards. Teachers see how AP® assessed the...
Radford University
Government Spending
Spend some time with lines of best fit. An informative unit has learners investigate government spending. They research data on poverty, educational spending, social security, and defense spending, and then analyze lines of best fit for...
Radford University
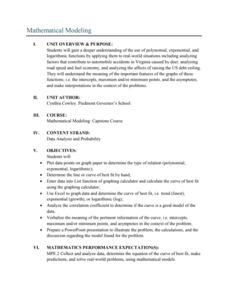
Mathematical Modeling: Lessons 2-3
Not all functions are created equal. Pupils apply regression analysis using polynomial, exponential, and logarithmic functions to investigate the relationship between variables and to decide which function would be best to model the...
Radford University
Let's Buy a Car
Ready to buy a car? Learners research different makes and models of cars to decide on the best one to buy. They collect data on cost, fuel efficiency, safety ratings, and insurance costs, then create and analyze data displays to make...
Radford University
How Normal Are You?
It's completely normal to learn about normal distributions. An engaging lesson has young statisticians collect and analyze data about their classmates as well as players on the school's football team. They determine whether each set of...
Radford University
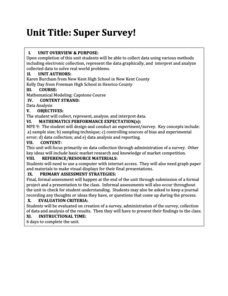
Super Survey!
Here's a super survey on supermarket products. An interactive lesson has classmates design and conduct surveys on a product of interest. They analyze the data, choose a data display method, and present their findings to the class.
Institute for Teaching through Technology and Innovative Practices
The Right Number of Elephants
How can you tell if a number of items is reasonable? Combine math and language arts with a fun lesson based on Jeff Shepard's The Right Number of Elephants. After reading the book, kids discuss amounts of other items and create minibooks...
University of California
Word Analysis Student Workbook
Seven strategies for deducing meaning (context clues and signal words, multiple-choice strategies, structural clues, direction, charge, word association, and deconstruction) are presented in a packet designed to develop word analysis...
Achieve
Corn and Oats
How much land does a parcel hold? How much fertilizer does it take for a field of corn? Pupils answer these questions and more as they apply ratio reasoning and unit analysis.
Willow Tree
Approximating a Line of Best Fit
You may be able to see patterns visually, but mathematics quantifies them. Here learners find correlation in scatterplots and write equations to represent that relationship. They fit a line to the data, find two points on the line, and...
Mathematics Assessment Project
100 People
It's a small world after all. In the middle school assessment task, learners use data that imagines there are only 100 people in the world to answer questions about population demographics. Young mathematicians use ratio and proportional...
CK-12 Foundation
Bar Graphs, Frequency Tables, and Histograms: Comparing Heights
Become a master at creating visual displays. Using a provided list of heights, users of the interactive create a bar graph and a histogram. They answer a set of challenge questions based on these data representations.
CK-12 Foundation
Misleading Graphs (Identify Misleading Statistics): Are Virgos Cursed?
Is it safe to take data at its face value? Pupils use the interactive to evaluate a claim that Virgos are more likely to get into a car crash than others. Individuals determine whether another variable may be at play.
CK-12 Foundation
Broken-Line Graphs: Heating Curve of Water
Examine the unique graphs coined broken-line graphs. Using the phase change of water for data, learners answer questions related to the temperature and energy at different times in the cycle of the phase change. Questions focus on the...
Concord Consortium
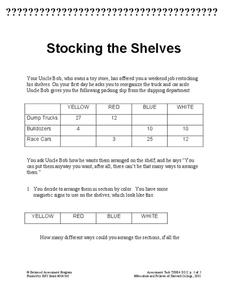
Stocking the Shelves
How many ways can you stock a shelf? It's probably more than you think! Young scholars use data in a frequency table to determine how many ways to stock a shelf given a specific constraint for types of groups. They then repeat the task...
Concord Consortium
Fermi Weight
Wait, there is an estimate for how much that weighs. The resource contains three questions about weight. Using dimensional analysis and benchmarks, pupils determine a reasonable weight for trash, food, and a grain of salt.
College Board
2011 AP® Statistics Free-Response Questions Form B
Is the sequel better than the original? The 2011 AP® Statistics free-response questions, Form B, is available for instructors to reference. Among the topics covered in the exam are histograms, distributions, studies and experiments,...
College Board
2008 AP® Statistics Free-Response Questions
Is your knowledge of statistics at an AP® level? Scholars try out the 2008 AP® Statistics free-response questions. The questions cover box plots, scatter plots, distributions, probability distributions, experiments, statistical tests,...
Achieve
Medication Dosage
Here's the cure to boredom. Given a patient file, including medication dosage information, scholars determine the amount of medication left in the patient's bloodstream over time. They analyze the sequence of numbers and determine a...
Other popular searches
- Data/math Literature
- Analyzing Data in Math
- Math and Data Management
- Math Lesson Data Management
- Task Analysis Math
- Counting Math Task Analysis
- Data Management Math
- Data Handling Math
- Math Data Collecting
- Data Analysis Math
- Math/data Mean Mode Median
- Math Data and Statistics


