University of Utah
Geometry: Transformations, Congruence, and Similarity
Rigid motions are to congruence as what are to similarity? Investigate properties of rigid motions and define congruence in terms of rigid motions with the ninth chapter of a 10-part eighth grade workbook series. The...
Curated OER
Ornithology and Real World Science
Double click that mouse because you just found an amazing lesson! This cross-curricular Ornithology lesson incorporates literature, writing, reading informational text, data collection, scientific inquiry, Internet research, art, and...
Curated OER
Digital Statistics
Research data analysis by creating charts in class. Define the differences between an "average" and "range" while examining measurement data based on student height. Utilize computer software to create a height graph which is shared with...
Curated OER
Creating Line Graphs
Pupils draw line graphs. In this math lesson, students interpret minimum wage data and graph the data in a line graph. Pupils predict the next minimum wage and figure the earnings for a 40 hour work week for someone earning the minimum...
Curated OER
Wheat Kernels Bar Graph
Third graders create a bar graph to record how many kernels were in a wheat stalk. They write in math journals two questions from interpreting the graph. They solve math problems from other students.
Curated OER
Reading Graphs
Students read graphs and charts to interpret results. In this algebra lesson, students interpret bar, line and pictographs. They draw conclusions and make predicitons based on these charts.
Curated OER
Plotting Data on a Graph
Students investigate graphing. In this graphing lesson, students survey the class and create graphs to reflect the data collected.
Curated OER
Statistics: Reading and interpreting production graphs
Students interpret and create different types of graphs. They analyze data from charts, develop a survey and design appropriate graphic illustrations and make a presentation.
Curated OER
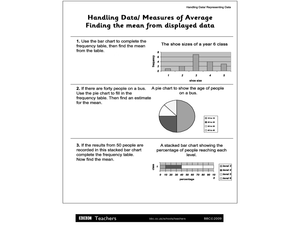
Handling Data/Measures of Average - Finding the Mean from Displayed Data
For this mean and average worksheet, students use the bars and charts to help them find the means using the given data. Students solve 3 problems.
Curated OER
Graphs Galore
Fourth graders conduct surveys to collect data. They analyze and interpret the data, then determine which type of graph is appropriate for the data. Students use the data to make predictions, discover patterns and draw conclusions...
Curated OER
Charting Animal Life Spans
Second graders research animal life spans and complete related math activities. In this life span lesson, 2nd graders read How Many Candles and discuss life spans. Students arrange animal cards based on their life spans. Students find...
Curated OER
Analyzing Graphs and Data
Students collect and analyze data. In this statistics lesson, students graph their data and make inferences from the collected data. They display their data using graphs, bar graphs, circles graphs and Venn diagrams.
Curated OER
Charting a New Course
Young scholars calculate the distance they will travel. In this geometry instructional activity, students use the TI and CBL system to make calculation of a certain path. They explore geography by calculating distances between different...
Curated OER
M&M Graphing and Probability
Learners create a variety of graphs. They count, sort, and classify M&M's by color and record data on a chart. They use data from the chart to create pictographs, bar graphs and circle graphs. They analyze data and determine...
Curated OER
Data Handling
In this data handling worksheet, students interpret data found in table, graphs and charts. They organize data and draw bar charts. This two-page worksheet contains 2 multi-step problems.
Curated OER
Frequency Tables; Discrete Ungrouped Data
In this frequency tables activity, students utilize given data to work out three frequency charts with one containing values and a pie chart involving angles for each value. Students complete three vertical line diagrams and check all...
Curated OER
It's My Time!
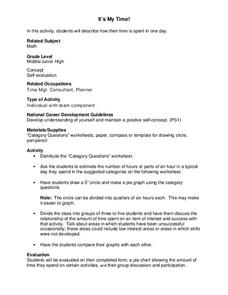
Students create a pie chart. In this time lesson, students determine the amount of time they spend on given activities. They create a pie chart diagraming the data. Students share their graphs with the class.
Curated OER
The Numbers Tell the Story
Students demonstrate how to gather and interpret statistical data. In this data analysis lesson, students search for statistics on the health effects of smoking and place the information into charts. Students create these charts online...
Curated OER
Analyze This
Students gain practice in the analysis of various types of graphs common in daily life. These examples often use graphic images like charts, graphs, tables, and pictures to supplement learning.
Curated OER
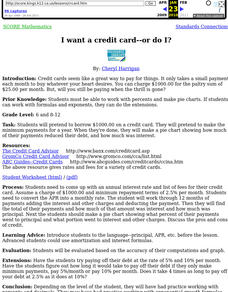
I want a credit card--or do I?
Students pretend to borrow $1000.00 on a credit card. They pretend to make the minimum payments for a year. When they're done, they make a pie chart showing how much of their payments reduced their debt, and how much was interest.
Curated OER
Time Management: Piece of Pie
Middle schoolers examine their own lives and how well they manage their time outside of school. For this this time management lesson, students discover the amount of time they spend on other activities, and create a pie chart with that...
Curated OER
Probability Using M&M's
Students estimate and then count the number of each color of M&M's in their bag. In this mathematics lesson plan, students find the experimental probability of selecting each color from the bag. Students create pictographs and bar...
Curated OER
Creating Circles
Students make a circle graph. In this graphing lesson, the teacher conducts a class survey, then demonstrates how to make a pie graph. When students are comfortable with the material, they use a worksheet to create their own graph.
Curated OER
EXCEL It!
Young scholars surf the Web gathering information about graphs. The data collected is incorporated into an Excel spreadsheet and graphs of varying nature generated to further enhance student understanding.


