T. Smith Publishing
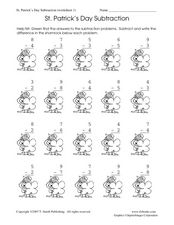
St. Patrick's Day Subtraction Worksheet 1
You are in luck! On this St. Patrick's Day-themed worksheet, little leprechauns compute the answers to 20 one-digit subtraction problems and write the answers in the shamrocks. They may also wish to color the shamrocks. An answer key is...
Curated OER
Patterns in Pascal's Triangle
Students examine the patterns in Pascal's Triangle. In this recognizing lesson, students view a model of Pascal's Triangle and describe the patterns of the multiples. Students identify the shapes that are made within Pascal's Triangle.
EngageNY
Equivalent Rational Expressions
Rational expressions are just fancy fractions! Pupils apply fractions concepts to rational expressions. They find equivalent expressions by simplifying rational expressions using factoring. They include limits to the domain of the...
EngageNY
A Focus on Square Roots
Pupils learn to solve square root equations and rationalize denominators. Problems include those with extraneous solutions.
EngageNY
Graphing Systems of Equations
Expand on learners' understanding of quadratic-linear systems. Building on the graphic understanding developed in the previous lesson, pupils learn algebraic methods of solving the systems.
Intel
Fair Games
Who said things were fair? The unit introduces probability and its connection to fairness. The class interacts with activities of chance and plays games to relate them to fairness. Groups design a fair game and develop a presentation....
Intel
Pedal Power
Show your classes the importance of mathematics in something as simple as bicycle design. The final lesson in the six-part STEM series has each group research a different aspect of the bicycle. Learners use mathematical formulas, linear...
American Statistical Association
You and Michael
Investigate the relationship between height and arm span. Young statisticians measure the heights and arm spans of each class member and create a scatter plot using the data. They draw a line of best fit and use its slope to explain the...
American Statistical Association
Scatter It! (Predict Billy’s Height)
How do doctors predict a child's future height? Scholars use one case study to determine the height of a child two years into the future. They graph the given data, determine the line of best fit, and use that to estimate the height in...
Kentucky Department of Education
Multi-Digit Multiplication Strategies
There is more than one way to solve a multiplication problem, and many learners find that the lattice multiplication method can be a helpful one. Fourth graders take an initial formative assessment before working in groups of two or...
Mathematics Vision Project
Module 1: Getting Ready Module
This fabulous resource is a must-have for any algebra teacher's arsenal of lessons. Developing the idea of equations and use of variables from basic physical scenarios, learners gain valuable intuition in the structure and meaning of...
Curated OER
Place Value - What Is the Value of the Place?
Second graders build number sense in an activity that requires the matching of base 10 representations to numbers. It is the teachers responsibility to gauge student understanding and involvement while class members work in groups.
Statistics Education Web
10,000 Steps?
Conduct an experiment to determine the accuracy of pedometers versus pedometer apps. Class members collect data from each device, analyze the data using a hypothesis test, and determine if there is a significant difference...
Statistics Education Web
The United States of Obesity
Mississippi has both the highest obesity and poverty rate in the US. Does the rest of the data show a correlation between the poverty and obesity rate in a state? Learners tackle this question as they practice their skills of regression....
Statistics Education Web
I Always Feel Like Somebody's Watching Me
Future statisticians and potential psychics first conduct an experiment to collect data on whether a person can tell if someone is staring at them. Statistical methods, such as hypothesis testing, chi-square tests, binomial tests, and...
Statistics Education Web
How Wet is the Earth?
Water, water, everywhere? Each pupil first uses an Internet program to select 50 random points on Earth to determine the proportion of its surface covered with water. The class then combines data to determine a more accurate estimate.
Statistics Education Web
Text Messaging is Time Consuming! What Gives?
The more you text, the less you study. Have classes test this hypothesis or another question related to text messages. Using real data, learners use technology to create a scatter plot and calculate a regression line. They create a dot...
Statistics Education Web
Who Sends the Most Text Messages?
The way you use statistics can tell different stories about the same set of data. Here, learners use sets of data to determine which person sends the most text messages. They use random sampling to collect their data and calculate a...
Statistics Education Web
The Case of the Careless Zookeeper
Herbivores and carnivores just don't get along. Using a box of animal crackers, classes collect data about the injury status of herbivores and carnivores in the box. They complete the process of chi-square testing on the data from...
American Statistical Association
Bubble Trouble!
Which fluids make the best bubbles? Pupils experiment with multiple fluids to determine which allows for the largest bubbles before popping. They gather data, analyze it in multiple ways, and answer analysis questions proving they...
American Statistical Association
Happy Birthday to . . . Two?
How many people do you need in a room before two likely share the same birthday? Scholars consider this puzzle by analyzing a set of data. They ponder how to divide the data and determine the proper size of a group for this event to...
EngageNY
The Special Role of Zero in Factoring
Use everything you know about quadratic equations to solve polynomial equations! Learners apply the Zero Product Property to factor and solve polynomial equations. They make a direct connection to methods they have used with quadratic...
EngageNY
Systems of Equations
What do you get when you cross a circle and a line? One, two, or maybe no solutions! Teach learners to find solutions of quadratic and linear systems. Connect the visual representation of the graph to the abstract algebraic methods.
EngageNY
Completing the Square (part 1)
Avoid the trap of memorizing steps when completing the square with a resources that provides a conceptual approach to completing the square. Learners that are able to recognize a perfect square trinomial are ready to complete the...


