EngageNY
Constant Rate
Two-variable equations can express a constant rate situation. The lesson presents several constant rate problems. Pupils use the stated constant rate to create a linear equation, find values in a table, and graph the points. The resource...
Virginia Department of Education
Nonlinear Systems of Equations
Explore nonlinear systems through graphs and algebra. High schoolers begin by examining the different types of quadratic functions and their possible intersections. They then use algebraic methods to solve systems containing various...
Curated OER
Relations and Graphs
Here is a simple, yet clever lesson on how to teach the important concepts of greater than, less than, and equal to. Pupils write their names down on grid paper - one letter per box. They compare their names and find a name that is...
Virginia Department of Education
Scatterplots
Math is all fun and games with this activity! Learners use an activity designed around hula hoops to collect data. They create scatter plots with their data and then analyze the graphs for correlation.
CK-12 Foundation
Identification of Quadratic Models: UFO Launch
Build conceptual understanding of graphs of quadratic functions with an out-of-this-world resource. An interactive lesson allows learners to manipulate a graph that models the launch of a UFO. The lesson focuses on the key features of...
CK-12 Foundation
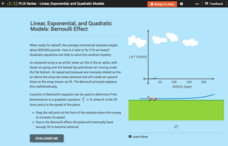
Linear, Exponential, and Quadratic Models: Bernoulli Effect
How can an object as heavy as an airplane fly? Turns out the answer is quadratic! Your classes explore the Bernoulli Effect through an interactive graph representation. As a plane increases in speed, the lift force also increases. Young...
CK-12 Foundation
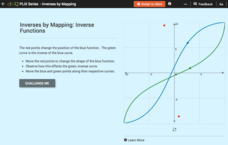
Inverses by Mapping: Inverse Functions
Map your way to successfully understanding inverse functions. Pupils use an interactive map to investigate how changes in the graph of a function affect the graph of its inverse. The results of the activity lead to the conclusion that...
CK-12 Foundation
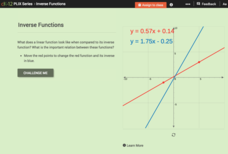
Inverse Functions
Provide a graphical view of inverses. Pupils manipulate points on a line and see the relationship of the graph with the graph of its inverse. Using the relationship between the graphs, scholars respond to questions concerning inverses...
CK-12 Foundation
Horizontal Translations or Phase Shifts: Tangent
Patterns can be shifty! Find the pattern when shifting the graph of tangent. Pupils move the graph of tangent to different locations on the coordinate plane. They observe what happens to the function and its vertical asymptotes...
CK-12 Foundation
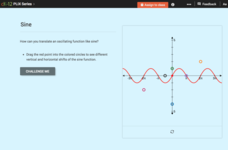
Horizontal Translations or Phase Shifts: Sine
Shift a trigonometric function and find its new equation. Pupils translate a sine function on a graph. The scholars determine the equation of the function that represents the translated graph and observe the connection between a...
CK-12 Foundation
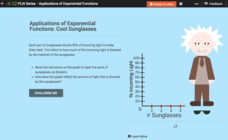
Exponential Decay: Cool Sunglasses
Who wouldn't want to wear four pairs of sunglasses? Each pair of sunglasses reduces the percent of incoming light by one-half. An interactive tutorial helps young mathematicians build a graph that models this scenario. They...
CK-12 Foundation
Horizontal Translations or Phase Shifts: Horizontal and Vertical Translations
It is all about the shift. Pupils translate the graph of a cubic function to different marked locations on the plane and determine the new equation that represents the shifts. The activity is designed to encourage individuals begin...
CK-12 Foundation
Intercepts by Substitution: Finding a Linear Product Using a Quadratic
Discover another way to interpret multiplication. Using an interactive, learners slide points (representing the factors of multiplication) along the x-axis of the graph of y = x^2 and observe changes in the line segment connecting the...
Scholastic
Study Jams! Pictograph
An easy and fun way to look at data is with a pictograph. A lesson plan friendly enough for multiple grade levels shows how to set up this graph with a corresponding key. The steps review the importance of choosing an appropriate...
Rice University
Prealgebra
Pre-algebra—all wrapped up in one place. The eBook contains everything needed to teach a typical Pre-Algebra course. Concepts in the course build upon previously learned concepts, allowing mathematicians to see the connections between...
CK-12 Foundation
Inverse Functions: Definition of Inverse Functions
Is the inverse of a function also a function? Pupils manipulate the graph of a function to view its inverse to answer this question. Using a horizontal and vertical line, class members determine whether the initial function is...
CK-12 Foundation
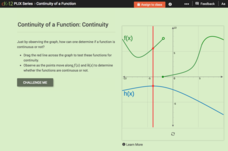
Continuity of a Function: Continuity
Does the point continually move along the graph? Pupils drag a line across two functions to determine whether they are continuous or not. They answer questions about the properties of continuous and discontinuous functions. Using their...
CK-12 Foundation
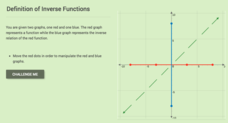
Definition of Inverse Functions
Investigate the definition of inverse functions graphically. Using the interactive, scholars create a graph of a function and view its resulting inverse. They then determine whether a group of functions have inverses that are also...
Curated OER
Graphing It Daily
Students identify and demonstrate a positive learning attitude and use basic concepts and skills. Learners also communicate clearly in oral, artistic, written, and nonverbal form. Finally, students participate in the daily data...
Curated OER
Graphs and Functions
Use this series of activities to introduce learners to graphing functions. They graph both linear and quadratic equations by hand and with a Graph Sketcher Tool. Several imbedded links and handouts are included in the lesson.
Curated OER
One Size Fits All, Part 1
Can you tell how tall someone is just by looking at their feet? In this activity, young mathematicians measure their height, arm span, and foot size, graph their findings, and answer questions about how these measurements are related....
Utah Education Network (UEN)
Linear Relationships: Tables, Equations, and Graphs
Pupils explore the concept of linear relationships. They discuss real-world examples of independent and dependent relationships. In addition, they use tables, graphs, and equations to represent linear relationships. They also use ordered...
Illustrative Mathematics
Fishing Adventures 1
Often inequalities exist in many real-world contexts but young math learners struggle with understanding how to represent that relationship in a simple equation using an inequality. This activity focuses on the basic concepts by using...
Curated OER
Graphing
Intended for a faith-based classroom, this lesson requires second graders to create a survey, conduct the survey in multiple classrooms, and graph the results. They can choose between creating a picture or bar graph, or you can require...


