Curated OER
Lesson 2: Measurement Tools
Elementary schoolers examine the uses of rulers, scales, and measuring cups. They determine the criteria for the use of each tool and visit different areas of school to find items that can be measured with these tools. Everyone takes...
Curated OER
Popcorn Math
Everyone loves popcorn! Use this treat to teach math concepts including place value, estimating, graphing, and volume. Eight possible activities are included, and they can be modified to fit all grade levels.
TryEngineering
What is a Nanometer?
Exactly how small is a nanometer? Scholars investigate the scale of a nanometer by measuring classroom objects and converting these measurements to nanometers.
Curated OER
Solar Kit Lesson # 12 - Calibration Curve for a Radiation Meter
Scientists need to have mastered algebraic slope-intercept concepts in order for this lesson to be effective. They will measure and graph solar panel output as a function of the amount of radiation striking it, discovering that there is...
Curated OER
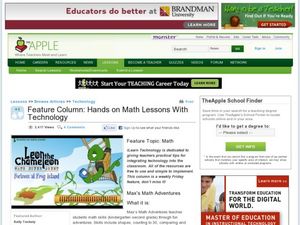
Feature column: Hands on Math With Technology
Young learners will view a math adventures video and practice math concepts. Afterwards they will navigate through Internet sites to participate in teacher selected math adventures. This guide walks you through integrating...
Teach Engineering
Bone Mineral Density Math and Beer's Law
Hop into a resource on Beer's Law. A PowerPoint presentation introduces Beer's law as part of calculating bone density from X-ray images in the sixth lesson plan in the series of seven. Individuals work on practice problems with this law...
Curated OER
Arc GIS Project: Visualizing the Holocaust
A cross-curricular lesson for middle schoolers that covers language arts, social studies, geography, and math, this is a great extension activity if your class is reading The Diary of Anne Frank or learning about the Holocaust....
Curated OER
Measure Twice
Students measure a variety of objects using the appropriate measuring tool. In this measurement lesson, students explain the importance of accuracy and precision in collecting data. They discuss the difference between the two.
Curated OER
Online Math Facts Games
Pupils use online games to reinforce math-facts knowledge, engage in a game the way they might be engaged in an arcade game, and try to be one of the class's top-scorers each week. A good filler or extension activity.
Teach Engineering
Measuring Surface Tension
How do you measure surface tension? The fifth installment of a nine-part series is an experiment where young scientists use tubes of different sizes to measure surface tension. They calculate the average and standard deviation of the...
Kenan Fellows
Designing and Analyzing Data Collected from Wearable Devices to Solve Problems in Health Care
Wearable devices have become more the norm than the exception. Learners analyze data from a sample device with a regression analysis in a helpful hands-on lesson. Their focus is to determine if there is a connection between temperature...
Curated OER
Are You Full of Hot Air?
Explore the concept of measuring and recording circumference. In this physical science and measurement lesson, young learners blow up balloons, measure the circumference, and record the data on an interactive graphing website.
Curated OER
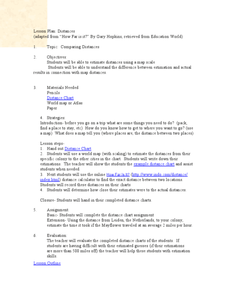
Comparing Distances
Students practice estimating distances by analyzing a map. In this length measurement lesson plan, students view a map with a distance key and use their measurement skills to estimate the distance between two cities. Students utilize an...
Curated OER
Tantalizing Tangrams
Students explore "area." In this tangram geometry and measurement lesson plan, students arrange tangram pieces to find the area of characters presented in a story they listen to on a website. Website information and related...
Curated OER
Basic Excel
Students explore basic Excel spreadsheets. In this spreadsheet lesson plan, students enter Alaska weather information and perform calculations. Students title the columns on the spreadsheet and format the cells. ...
Curated OER
Correlation of Variables by Graphing
Middle and high schoolers use a spreadsheet to graph data. In this graphing lesson, learners determine how two parameters are correlated. They create a scatter plot graph using a computer spreadsheet.
Teach Engineering
Measuring Viscosity
Groups use a marble to determine the viscosity of household fluids. The procedure calls for pupils to measure the amount of time it takes a marble to fall a specified distance in the fluids. Using unit conversions and algebra, the teams...
Teach Engineering
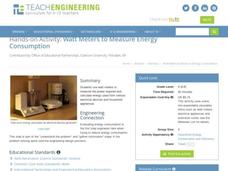
Watt Meters to Measure Energy Consumption
It used watt amount of energy? This resource investigates the power usage of small household appliances. Using a watt meter, groups measure the actual wattage used by an appliance and then calculate the energy used daily.
Curated OER
Exploring Perimeter
Students explore perimeter. For this geometry and measurement lesson, students create squares and rectangles using given perimeters. Students construct four sided shapes with given perimeters using the computer program "Math Keys:...
Curated OER
Electricity - How it Works and How We Measure and Pay For It
Students investigate energy consumption by researching wattage. In this electricity lesson, students discuss how electricity works and gets transferred to our electronic devices through generators and circuits. Students...
Curated OER
Prime Time Math: Emergency
Eighth graders, while using Prime Time Math: Emergency software, use math and medical data to participate in the diagnosis of a girl. Just like the medical team in the story, they will be using math to respond to a medical emergency- a...
Curated OER
Gummy Bear Math
First graders predict, collect data, and create a graph based on gummy bear colors they are given. For this graphing lesson plan, 1st graders first predict how many colors of gummy bears there are. They then count the colors, graph them,...
Curated OER
Measuring Speed With iMovie
Students record each other running, walking, throwing a ball, or doing a similar activity for a set distance. They import the video clips into iMovie. They compute how long it took in miles per hour.
Curated OER
Shoe Showdown
Third graders use rulers to measure their shoe size in inches and centimeters. They then enter the class shoe measurements into an excel data base and graph the results of both to make the comparison.


