Curated OER
Veggie Chop and Data Analysis
First graders chop vegetables into fractions. In this fractions lesson plan, 1st graders cut vegetables, collect data about favorite vegetables and create a bar graph using the information. Students make inferences about the data...
Curated OER
Secret Agent Stan
Young scholars answer time and money questions to solve a mystery. For this time and money lesson, students act as detectives to find Secret Agent Stan's identification number by answering questions from his logbook involving elapsed...
Curated OER
Bag the Beans
Students are exposed to a wide array of concrete representations to help develop a foundation for the higher abstract ideas associated with mathematical inquiry. In this lesson, students will work with manipulatives (beans) to create and...
Curated OER
Transformations and Exponential Functions
Tenth graders study graphing exponential functions. In this transformations lesson, 10th graders apply inquiry to determine how changes to a parent function affect its graph. Students analyze transformed graphs and generate the function...
Curated OER
Adding Integers with Counters
Students add integers and use counters to create a visual. In this algebra lesson, students work in pairs as they use the computer to add integers. They complete an assessment on adding integers at the end of the activity.
Curated OER
EASY AS PUMPKIN PIE
Students demonstrate place values using pumpkin seeds as a math manipulative. They use manipulatives, models, known facts, properties and relationships to explain thinking processes. They estimate the number of seeds in their pumpkin.
Curated OER
Indeterminate Forms and L'Hopital's Rule
In this limits worksheet, students use Taylor's Theorem to solve two short answer problems. They use L'Hopital's Rule to solve two short answer problems. Students read a two page lesson on limits.
Curated OER
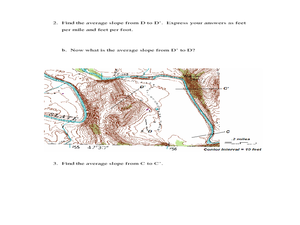
Slope and Topographic Maps
Students investigate slopes as they study topographic maps. In this algebra instructional activity, students discuss and apply the concept of slopes to graphing and analyzing data.
Curated OER
Angle Explorations
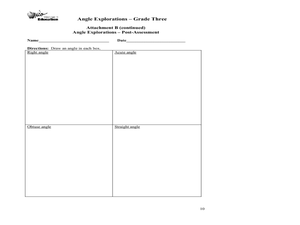
Third graders observe angles in their classroom and create an angle finder to represent them.In this angles lesson, 3rd graders classify angles as acute, obtuse, right or straight. Students find the differences and similarities in angles.
Curated OER
Explore the Ocean
Learners explore the oceans from their origin. In this oceans lesson plan, students read and discuss excerpts from the Book of Genesis regarding the creation of the ocean. Learners then clean up a mock oil spill, measure the volume and...
Curated OER
Introduction to Fractals: Geometric Fractals
Learners study and observe the patterns made by the areas of the Sierpinski Triangle. Students use the computer to draw two or three iterations to discover the number patterns. Learners complete worksheets based on Geometric Fractals.
Curated OER
The Golden Ratio
Seventh graders investigate a ratio found in nature and in numerous pieces of artwork throughout history. The lesson is cross-curricular and builds a sense of appreciation of design for students.
Curated OER
Going out of Business: Pythagorean Theorem
Students find the length of diagonals. In this Pythagorean theorem lesson plan, students use the Pythagorean theorem to determine the length of diagonals.
Curated OER
Money: Kids and Cash
Learners discuss what a bank is and what it is used for. In this mathematics lesson, students solve problems related to interest and percentages.
Curated OER
Ravishing Rings (Multiplication with a Snack)
Students understand multiplication through the use of snack manipulatives. In this multiplication lesson plan, students solve a multiplication problem using pretzels and then create and answer original problems. Students analyze how they...
Curated OER
Problem Solving Using Power Polygons
Students investigate geometric shapes by creating figures on a plane. In this polygon lesson, students complete a worksheet based on the angles in a power polygon. Students identify the different types of polygons and define their...
Curated OER
Pounds and Ounces: It's All About Weight
First graders explore number sense by participating in a measurement estimation activity. In this weight lesson, 1st graders discuss the differences between measurement units, both English and Metric. Students examine a loaf of bread to...
Curated OER
The Greedy Dog
Teach young mathematicians the concepts of greater than, less than, and equal to with kinesthetic, visual, verbal, and numeric approaches. In a playful session that addresses multiple intelligences, your class will: dramatize a greedy...
EngageNY
Mid-Module Assessment Task - Algebra 2 (Module 3)
The 15th installment of a 35-part module is a mid-module assessment task. Covering concepts in the first half of the module, the task acts as a formative assessment, providing you with valuable information on how learners are doing.
Curated OER
Things in a Line
Little learners recognize symbols, objects and how to depict numbers. In this matching lesson, they can match the number names with a set of items, model ordinal numbers, and complete a cute, cartoon-character worksheet.
American Statistical Association
EllipSeeIt: Visualizing Strength and Direction of Correlation
Seeing is believing. Given several bivariate data sets, learners make scatter plots using the online SeeIt program to visualize the correlation. To get a more complete picture of the topic, they research their own data set and perform an...
Teach Engineering
Exploring Energy: Kinetic and Potential
The potential of the energy in the class is moving. The third segment in a six-part unit on energy provides a deeper understanding of kinetic and potential energy. Learners understand the relationship between mass, speed, and energy and...
American Statistical Association
Scatter It! (Using Census Results to Help Predict Melissa’s Height)
Pupils use the provided census data to guess the future height of a child. They organize and plot the data, solve for the line of best fit, and determine the likely height and range for a specific age.
American Statistical Association
Tell it Like it is!
Scholars apply prior knowledge of statistics to write a conclusion. They summarize using correct academic language and tell the story of the data.


