Curated OER
Scattered About
Students are introduced to the concept of scatter plots after reviewing the various types of graphs. In groups, they analyze the type of information one can receive from a scatter plot and identify the relationship between the x and y...
Curated OER
Using Numbers Everywhere
Kindergarteners explore various representations and uses of numbers to develop number sense. They participate in an activity and arrange patterns into groups. Students compare the sets and describe the objects in each set.
EngageNY
More on Modeling Relationships with a Line
How do you create a residual plot? Work as a class and in small groups through the activity in order to learn how to build a residual plot. The activity builds upon previous learning on calculating residuals and serves as a...
Curated OER
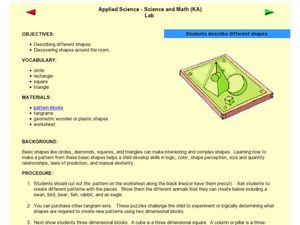
Applied Science - Science and Math (K) Lab
In this shape lesson, learners cut out tangram shapes and create different pictures with them. They look at 3-D shapes as well. There is a nice, hands-on component built into this lesson.
Curated OER
Math Activity File
Third graders describe the difference between area and volume and also explain how various units of measure relate to one another.
Alabama Learning Exchange
Bloodstain Pattern Doesn't Lie......
An interesting instructional activity on hypothesizing about the diameter of a drop of blood that is splattered. To test their theories, learners work in groups to make blood droplets splatter from different heights. They use graphed...
Curated OER
Applied Science - Science and Math Lab
Students investigate topology. In this Applied Science lesson students explore higher, more abstract mathematics using tangles. Students make topologically related shapes.
Pennsylvania Department of Education
Analyzing Numeric and Geometric Patterns of Paper Pool
Students use concrete and pictorial representation of geometric patterns to extend patterns. In this geometric patterns lesson plan, students identify patterns and extend them.
Curated OER
Investigation-Pattern/Functions
Young scholars explore number patterns. In this number patterns and probability math lesson, students work in groups to describe the patterns present in the first five rows of Pascal's Triangle, then write numbers to continue this...
Curated OER
Number Patterns
Fourth graders recognize patterns in a series of numbers and symbols. They also make their own patterns and explain them in writing. After practicing with a worksheet imbedded in this plan, 4th graders attempt to make up their own number...
Curated OER
Patterns That Grow
Students investigate growing patterns. In this additive patterns lesson, students analyze the core of growing patterns. Students extend additive patterns based on the core.
Curated OER
Patterns in Pascal's Triangle
Students examine the patterns that exist in Pascal's Triangle. They explore multiples and factors. Sudents use an applet to create and color the multiples in Pascal's Triangle.
Curated OER
Multicultural Math Project
Sixth graders examine where mathematics came from. In this Math History lesson, 6th graders complete various activities to understand mathematical reasoning. Students complete critical thinking questions.
Curated OER
Pascal's Triangle
Students explore the concept of Pascal's Triangle. In this Pascal's Triangle lesson plan, students use an applet called 'Coloring Multiples' to explore Pascal's Triangle. Students develop patterns starting with various numbers in...
Curated OER
Visualizing Multiplication
Upper graders represent multiplication of a two-digit number by a two-digit number as the area of a rectangle with dimensions of the two factors. They find patterns for the number of different base ten blocks in a rectangle representing...
Curated OER
SuperShapes, Part 1; "Tri"ing Triangles
An outstanding lesson on triangles awaits your math scholars. Learners focus on the triangle, which is the strongest of all polygons. They see the role that triangles play in the design of buildings, and learn about triangle...
NTTI
Putting Together Ten
Groups explore sets of 10 items in two varieties (i.e. 3 white buttons and 7 black ones, or 5 bears and 5 bunnies). They brainstorm about their objects, write math sentences to represent what they have, and report their discoveries...
EngageNY
Scatter Plots
Scholars learn to create scatter plots and investigate any relationships that exists between the variables with a lesson that also show them that statistical relationships do not necessarily indicate a cause-and-effect...
Computer Science Unplugged
Count the Dots – Binary Numbers
Did you know you can send a message using only zeroes and ones? This interactive resource presents an introduction to binary numbers. Through code cards, pupils learn to convert binary numbers to decimal numbers.
EngageNY
Graphing Quadratic Functions from Factored Form
How do you graph a quadratic function efficiently? Explore graphing quadratic functions by writing in intercept form with a lesson plan that makes a strong connection to the symmetry of the graph and its key features before individuals...
EngageNY
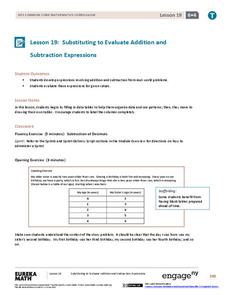
Substituting to Evaluate Addition and Subtraction Expressions
Substitute this resource for what you used to use. Learners identify patterns in data tables and write addition and subtraction expressions to represent relationships. Substitution allows them to solve problems in context in the 20th...
EngageNY
Informally Fitting a Line
Discover how trend lines can be useful in understanding relationships between variables with a lesson that covers how to informally fit a trend line to model a relationship given in a scatter plot. Scholars use the trend line to make...
Virginia Department of Education
Types of Variations
Scholars determine how two quantities vary with respect to each other. They complete a fill-in-the-blank activity by stating whether the entities vary directly, inversely, or jointly, create equations that match different variations, and...
Virginia Department of Education
Perfecting Squares
Here's a perfect way to introduce perfect squares. Individuals color in the diagonals of squares and record observations about patterns. They connect their diagrams to exponents of two and perfect squares.


