Scholastic
Study Jams! Pictograph
An easy and fun way to look at data is with a pictograph. A lesson plan friendly enough for multiple grade levels shows how to set up this graph with a corresponding key. The steps review the importance of choosing an appropriate...
Curated OER
Ice Cream Pictograph
Students create a graph. In this pictograph lesson, students cut out 20 small ice cream cones and decorate them. Students create a pictograph with their ice cream cones.
National Security Agency
Line Plots: Frogs in Flight
Have a hopping good time teaching your class how to collect and graph data with this fun activity-based lesson series. Using the provided data taken from a frog jumping contest, children first work together...
Curated OER
Read a Picture Graph
It's the Bears vs. the Seals! Who is the season winner? Read this data and have your math class answer the six questions that follow. Consider graphing the chart as a class, or encouraging individuals to graph it before answering the...
Curated OER
Make and Read a Picture Graph
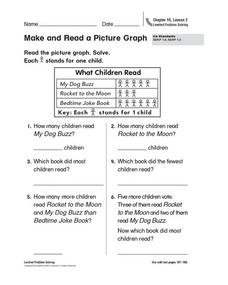
What books do you like? Have your learners read and interpret a picture graph detailing a fictional class's favorite books. Consider conducting a survey of your learners' favorite books and plotting the results as a class!
Curated OER
Make a Pictograph
For this pictograph worksheet, 2nd graders create a pictograph involving colors they see the most often in clothing, recording marks and placing those marks in three boxes labeled red, blue and green. Students cut out squares for each 5...
Curated OER
Using a Pictograph
In this problem solving learning exercise, 5th graders answer four questions using the pictograph provided. The learning exercise pertains to sports.
Curated OER
"Eggs-ploring" Math with Jellybeans
Learners work in pairs with a small bag of jellybeans to estimate the number of candies in their bags and then figure out how many groups of 10 jellybeans are contained in their bags. They then graph the information using a pictograph or...
Curated OER
Survey Says...
Young learners create and implement a school-wide survey about student body favorites! Learners record and analyze the data on a bar graph, picture graph, and line graph, and then display the data. Then, wrap it all up with a celebration...
Curated OER
Gummy Bear Picture Graph
First graders investigate picture graphs. In this graphing lesson, 1st graders create a picture graph with the x-axis being number and the y-axis being color. Students sort their gummy bears by color and use pictures of colored bears...
Curated OER
A Reading Graph
Students construct and interpret a "favorite classroom books" graph. In this literacy and math graphing lesson, students choose a reduced size copy of the book cover that corresponds with the book(s) they chose to read during their...
Curated OER
Graphing
Intended for a faith-based classroom, this lesson requires second graders to create a survey, conduct the survey in multiple classrooms, and graph the results. They can choose between creating a picture or bar graph, or you can require...
Curated OER
Comparing School Bus Stats
Engage in a lesson plan that is about the use of statistics to examine the number of school buses used in particular states. They perform the research and record the data on the appropriate type of graph. Then they solve related word...
Curated OER
Lucky Charms Pictograph
Third graders create pictographs using a breakfast cereal. This fun, hands-on lesson plan allows students to use Lucky Charms cereal to create a pictograph. When the lesson plan is through, 3rd graders get to eat their Lucky Charms...
Curated OER
Classmate Pictograph
Learners create pictographs using their classmates in this technology-based lesson plan. The lesson plan uses Inspiration, or Kidspiration, digital cameras, and a downloadable pictograph template.
Alabama Learning Exchange
Tiger Math Graphing
Learners practice various skills using the book Tiger Math: Learning to Graph from a Baby Tiger. After listening to the story, they create a pictograph using data collected from the text. They also color a picture of a tiger,...
Curated OER
Creating and Reading a Pictograph
Second graders examine how data can be transferred into pictures on a pictograph. They analyze data on a graph about chewing gum, and create a pictograph that illustrates data about their preferences for the taste of bubble gum. ...
Curated OER
M&M Graphing and Probability
Students sort, classify, and graph M & M's. They create pictographs and bar graphs with the colors and numbers in each bag of M & M's. They calculate the ratio and probability based on class results.
Curated OER
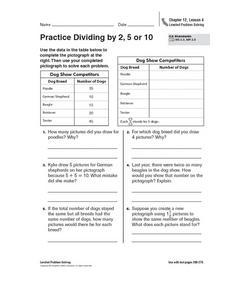
Practice Dividing by 2, 5, or 10
In this pictograph problem solving worksheet, students analyze the data on a table and create a pictograph. Students read and solve 6 story problems about the pictograph.
Curated OER
Birthday Graph
Students explore graphs. In this graphing math instructional activity, students record the birthdays of each classmate on a data table. Students cut out and add a picture of a birthday cake to a floor or wall pictograph...
Curated OER
Usage and Interpretation of Graphs
Young scholars explore graphing. In this graphing lesson, students predict how many shoe eyelets are present in the classroom. Young scholars count eyelets and work in groups to organize and chart the data collected. Students put all the...
Curated OER
Rubber Band Banza
Third graders review ideas about sound and vibration to make their own stringed instrument. They review what a pictograph and bar graph are. Pupils conduct a survey within the classroom to choose the four favorite string instruments and...
Curated OER
Jack and the Beanstalk Math
Students listen to Jack and the Beanstalk and determine what they think are the most common words. In this Jack and the Beanstalk lesson plan, students reread the story, count the words they chosen and graph those words. Students...
Virginia Department of Education
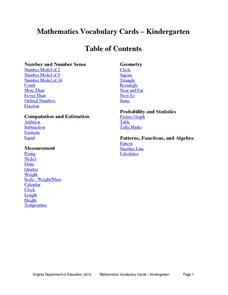
Mathematics Vocabulary Cards - Kindergarten
Enhance your math lesson with a series of pictures that illustrate different math concepts. The vocabulary includes a variety of ideas and pictures including fractions, ordinal numbers, picture graphs, and number lines.


