Statistics Education Web
Consuming Cola
Caffeine affects your heart rate — or does it? Learners study experimental design while conducting their own experiment. They collect heart rate data after drinking a caffeinated beverage, create a box plot, and draw conclusions....
National Council of Teachers of Mathematics
Eruptions: Old Faithful Geyser
How long do we have to wait? Given several days of times between eruptions of Old Faithful, learners create a graphical representation for two days. Groups combine their data to determine an appropriate wait time between eruptions.
Statistics Education Web
What Does the Normal Distribution Sound Like?
Groups collect data describing the number of times a bag of microwave popcorn pops at given intervals. Participants discover that the data fits a normal curve and answer questions based on the distribution of this data.
Statistics Education Web
Double Stuffed?
True or false — Double Stuf Oreos always contain twice as much cream as regular Oreos. Scholars first measure the masses of the filling in regular Oreos and Double Stuf Oreos to generate a class set of data. They use hypothesis testing...
Computer Science Unplugged
Twenty Guesses—Information Theory
How do we determine how much information to include and what can be left out? By playing a game of 20 questions, the class generates the best strategies for finding a number. They then move on to guessing the next letter in a short...
101 Questions
Marine Ramp
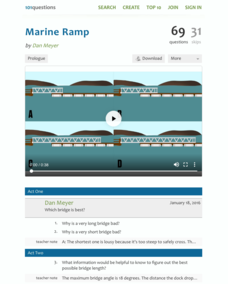
Boat ramps move with waves and changes in water level. Scholars decide on the proper length for a ramp so the angle connecting both sides is appropriate. They visualize the situation and use a simulation to view the results with their...
Radford University
A Change in the Weather
Explore the power of mathematics through this two-week statistics unit. Pupils learn about several climate-related issues and complete surveys that communicate their perceptions. They graph both univariate and bivariate data and use...
Kenan Fellows
Balancing Equations Using Matrices
Matrices help solve systems of equations in chemistry, computer graphics, circuitry, probability, and more. The second lesson in a seven-part series focuses on using matrices to balance chemical equations. Pupils rely on the Law of...
Curated OER
Probability Review
High schoolers engage in a lesson plan that is concerned with the concepts related to probability. They review the key properties of statistics involved in the measurement of probability that includes mean, median, and mode. The lesson...
Curated OER
Probability or Ability?
Students fill in a probability chart while attempting to catch candy with their non-dominant hands. They replicate the activity with a coin.
Curated OER
Next Year's Seeds
Sixth graders explore agricultural issues using math and probabilities. In this agriculture lesson, 6th graders investigate real world situations in agriculture using math and probabilities.
Curated OER
Alpha- Bits
In this probability worksheet, students solve 8 word problems that pertain to possible outcomes and probability of drawing alphabet letters from a bag.
Curated OER
Do You Feel Lucky?
Students calculate simple probabilities using mathematics then roll dice to test their predictions.
Curated OER
Cube Toss
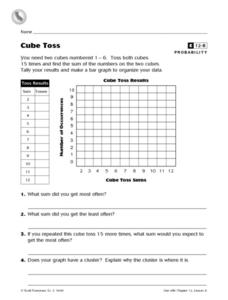
In this probability and graphing worksheet, students solve 8 problems in which data from a cube toss is displayed on a table and graph. Students answer the questions about their results.
Curated OER
What's in the Bag?
Students calculate the probability of an event occurring. In this statistics instructional activity, students calculate the outcome using combination and permutation. They differentiate between-theoretical and experimental probability.
Curated OER
Listing Outcomes
In this probability learning exercise, students learn how to make a tree diagram to determine the possible outcomes in a probability situation. They then answer 4 probability questions.
Curated OER
Costume Choices
In this probability worksheet, 6th graders create as many different costume combinations as they can based on the information they are given.
Curated OER
Math: How Many Red M&Ms?
Sixth graders calculate the mean, median, and mode of candy M&Ms and find the percentage of each color. Once they complete the assignment, they compare their results with those of the candy company's percentages. As an extension,...
Curated OER
A Data Processing Lesson for Statistics -- Reading a Table or Chart
Learners identify the structure and key parts of tables and charts. They determine which data is meanjngful and make comparisons with the data. They describe the scope of the AIDS plague throughout the world.
Pennsylvania Department of Education
Up on Top
Students make bar graphs and identify items in the bar graphs as being likely, certain, or impossible. In this bar graphs lesson plan, students answer questions about the bar graphs using reasoning and communication skills.
Curated OER
Quick Stats with Quick Poll
Learners analyze data using bar graphs and the TI in this statistics lesson. They investigate quick polls and graph the data using different properties of statistics. This assignment requires a TI Navigator.
Curated OER
Statistics Related to the First World War
In this history and probability worksheet, students examine a chart of statistics associated with World War I which include total of men in the war by nation, number of deaths, and number of men taken prisoner. They answer 5 questions...
Curated OER
Coin Tossing
Sixth graders examine the use of probability and compare it to actual real world results. In groups, they flip a coin a specific number of times while their other group members roll a set of dice the same amount of times as the coin. To...
Other popular searches
- Probablity Math Lessons
- Probability Math Lessons
- Math Lessons Probabilities
- Math Lessons/ Probability
- Math Lessons on Probability


