West Contra Costa Unified School District
Exploring Quadratics and Graphs
Young mathematicians first graph a series of quadratic equations, and then investigate how various parts of the equation change the graph of the function in a predictable way.
Flipped Math
Calculus AB/BC - Estimating Limit Values from Graphs
A one-sided limit need not be half as interesting as a two-sided limit. Pupils learn the notation for one-sided limits and how to determine the value of a one-sided limit from graphs by watching a short video. They then see how to create...
National Security Agency
Line Graphs: Gone Graphing
Practice graphing and interpreting data on line graphs with 36 pages of math activities. With rationale, worksheets, and assessment suggestions, the resource is a great addition to any graphing unit.
Balanced Assessment
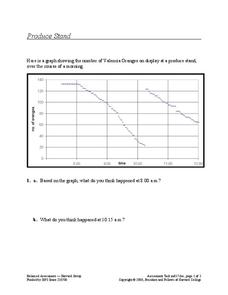
Produce Stand
Interpret a graph of the number of oranges at a produce stand to determine a likely event at different times. They also analyze the graph to determine which time period oranges were selling most quickly.
Curated OER
Graphs: Students in Math Classes
Are your second and third graders just beginning to read bar graphs? This graph looks at the number of learners present in a math class Monday-Friday. Learners look for basic information, and the graph is easy to read.
CK-12 Foundation
Graphs of Functions Based on Rules: Plotting Profits
Profit from this interactive on graphing and interpreting functions. An interactive allows learners to plot a square root function representing a company's profits. They answer some challenge questions that require interpreting this...
BW Walch
Creating and Graphing Exponential Equations
Frequently found in biology and economic application problems, exponential equations show up as stars in this introductory presentation. Taking no background or knowledge of exponentials for granted, the slides walk learners...
Flipped Math
Calculus AB/BC - Sketching Graphs of Functions and Their Derivatives
Find deeper meaning in graphs. Pupils use the knowledge gained from the previous sections in the unit to sketch graphs of a function's derivative. Learners also see how to sketch a graph of a function given the graph of its derivatives....
Shodor Education Foundation
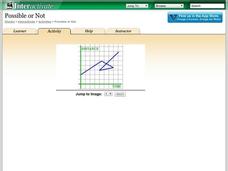
Possible or Not?
What does the graph mean? Pupils view 10 graphs and determine whether they are possible based on their contexts. The contexts are distance versus time and profit versus time.
Curated OER
What's in a Graph?
Students explore how to use and interpret graphs. The graphs are pulled from a variety of sources, and the activities ask students to interpret graphs. They start this lesson with knowledge of what a graph is. Students also know how to...
Alabama Learning Exchange
Tiger Math Graphing
Learners practice various skills using the book Tiger Math: Learning to Graph from a Baby Tiger. After listening to the story, they create a pictograph using data collected from the text. They also color a picture of a tiger,...
Inside Mathematics
Graphs (2004)
Show your pupils that perimeter is linear and area is quadratic in nature with a short assessment task that requests learners to connect the graph and equation to a description about perimeter or area. Scholars then provide a...
EngageNY
Geometric Interpretations of the Solutions of a Linear System
An intersection is more than just the point where lines intersect; explain this and the meaning of the intersection to your class. The 26th segment in a 33-part series uses graphing to solve systems of equations. Pupils graph linear...
Curated OER
What's in a Graph?
How many yellow Skittles® come in a fun-size package? Use candy color data to construct a bar graph and a pie chart. Pupils analyze bar graphs of real-life data on the Texas and Massachusetts populations. As an assessment at the end...
EngageNY
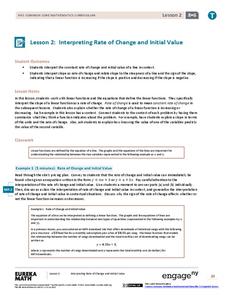
Interpreting Rate of Change and Initial Value
Building on knowledge from the previous lesson, the second lesson in this unit teaches scholars to identify and interpret rate of change and initial value of a linear function in context. They investigate how slope expresses the...
Curated OER
Function Graphing--ID: 8252
Those graphing calculators can be tricky; good thing Texas Instruments has devised a lesson on how to use their TI-Nspire calculator to graph functions. Kids investigate functional notation as they graph ordered pairs in the form (a,...
Curated OER
Where Did the Bunny Leave the Eggs? Picture Graphing Activity
The Easter Bunny left us a bunch of eggs, but how many did he leave? Learners use the data to create a picture graph, interpret it, and answer the questions that follow. There's even easy egg cut-outs for your youngsters!
Curated OER
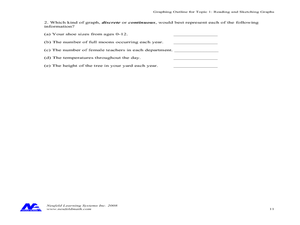
Reading and Sketching Graphs
For this graphs worksheet, learners answer 15 multistep questions about graphs. Students determine distance traveled, time, velocity, and create scenarios to fit the graph.
Illustrative Mathematics
Favorite Ice Cream Flavor
What better way to engage children in a math lesson than by talking about ice cream? Using a pocket chart or piece of chart paper, the class works together creating a bar graph of the their favorite ice cream flavors. Learners then work...
Curated OER
When Ants Fly
Here is a great instructional activity on constructing line graphs. Learners identify common characteristics of birds, ants common needs of all living things. They also write a story from the perspective of an ant or a bird that has lost...
Intel
What Does This Graph Tell You?
What can math say about natural phenomena? The fifth STEM lesson in this project-based learning series asks collaborative groups to choose a phenomenon of interest and design an experiment to simulate the phenomenon. After collecting...
Curated OER
Going Graph-y
Second graders listen to and dicuss the story Where the Wild Things Are. They play a pantomime game and act out various feelings so their classmates can guess. They listen for the frequency of certain words, and record their findings on...
Curated OER
Graph It!
There is more than one way to represent data! Learners explore ways to represent data. They examine stacked graphs, histograms, and line plots. They conduct surveys and use stacked graphs, histograms, or line plots to chart the data they...
EngageNY
Modeling a Context from a Verbal Description (part 2)
I got a different answer, are they both correct? While working through modeling problems interpreting graphs, the question of precision is brought into the discussion. Problems are presented in which a precise answer is needed and...


