National Research Center for Career and Technical Education
STEM: Lou-Vee Air Car
A comprehensive activity on acceleration awaits your physicists and engineers! Two YouTube videos pique their interest, then sample F=ma problems are worked and graphed. The highlight of the activity is the building of a Lou-Vee air car!...
National Research Center for Career and Technical Education
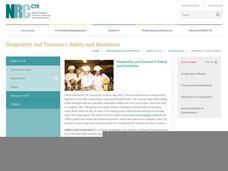
Hospitality and Tourism 1: Safety and Sanitation
Math and science come alive in this career-related lesson plan on sanitation. Along the way, learners explore bacterial growth rates using exponential notation and graphs. A link to a very brief, but vivid video shows just how quickly...
Teach Engineering
Energy Forms and States Demonstrations
Does a tennis ball have energy? What about a bowling ball? Demonstrate concepts of different forms of energy forms and states with a variety of objects. Using the equations for potential and kinetic energy,...
Texas Instruments
TI-Nspire™ CAS
When it comes to rating educational calculators, this calculator is always near the top of this list. Now it's available as an app. There is a lot of calculator power wrapped up in this app. Not only is this a fully functioning...
Institute of Electrical and Electronics Engineers
Sugar Crystal Challenge
Blow your learners' minds with a sweet lesson on nanotechnology that uses sugar to demonstrate the difference nanoscale surface area makes in dissolving and crystal formation. Plenty of supportive background information is read to...
Curated OER
Bouncing Ball
Students collect height versus time data of a bouncing ball using the CBR 2™ data collection device. Using a quadratic equation they graph scatter plots, graph and interpret a quadratic function, apply the vertex form of a quadratic...
Teach Engineering
Bone Density Math and Logarithm Introduction
What do logarithms have to do with bone density? Scholars learn that the equation for bone density includes logarithms. The majority of the third lesson of seven is devoted to logarithms and their properties.
Curated OER
Comparing Light Bulbs
An average home produces twice as many emissions as an average car. Teach your class how to reduce energy consumption by replacing standard incandescent light bulbs with compact fluorescent light bulbs. Perform an experiment to compare...
Curated OER
History of Flight Timeline Activity
Scholars are introduced to the significant events that led to the development of today's modern forms of air travel. They create a timeline to identify the vital events that are related to man's flight. In addition, they research various...
Curated OER
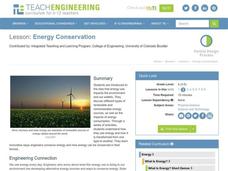
Energy Conservation
Students investigate energy conservation. In this energy conservation and analyzing data lesson, students identify and explain several energy sources and research renewable and nonrenewable energy sources. Students use statistics...
Curated OER
Scientific Notation
Review conversion of decimal numbers into SN form with these examples of common astronomical applications and quantities. Young learners rewrite those numbers with scientific notation and with the correct units. The answers are available...
Alabama Learning Exchange
Diverse Life Forms of the Ocean
Young scholars recognize marine organisms and differentiate between plankton and nekton. In this investigative instructional activity students create a concept map using their list of terms and study marine life forms.
Cornell University
Math Is Malleable?
Learn about polymers while playing with shrinky dinks. Young scholars create a shrinky dink design, bake it, and then record the area, volume, and thickness over time. They model the data using a graph and highlight the key features of...
EngageNY
TASC Transition Curriculum: Workshop 8
Lights, camera, action! Math educators consider how to improve their instruction by examining a model of the five-practice problem-solving model involving a movie theater. Participants examine cognitive demand in relation to problem...
Alabama Learning Exchange
How Clouds Form
Young scholars analyze how clouds form. In this cloud formation lesson, students brainstorm types of clouds and what they think they're made of. Young scholars conduct an experiment to see how clouds form and discuss their observations....
Teach Engineering
Measuring Surface Tension
How do you measure surface tension? The fifth installment of a nine-part series is an experiment where young scientists use tubes of different sizes to measure surface tension. They calculate the average and standard deviation of the...
Baylor College
We Need Water
There's nothing quite like a glass of ice-cold, freshly squeezed lemonade. Lesson seven of this series explains how the water humans need to survive can come in many forms. Teach your class about how much water humans require every day...
Curated OER
Re-Presenting Race in the Digital Age
Teen-aged scientists analyze a graphic organizer of how trash is removed from New York City and then answer standard questions about a graph and a diagram. Resources are mentioned, but there are no links to these resources, so you will...
Teach Engineering
Bone Mineral Density Math and Beer's Law
Hop into a resource on Beer's Law. A PowerPoint presentation introduces Beer's law as part of calculating bone density from X-ray images in the sixth lesson in the series of seven. Individuals work on practice problems with this law and...
Discovery Science Center
Kindergarten Observing, Comparing and Contrasting
Although this is a science lesson, it can be adapted to help meet Common Core standards in math as well. Starting scientists describe physical properties of objects and explore three forms of water. To address the Common Core, they can...
Curated OER
Infrared-Hot
Students describe how the sun heats the Earth, explain the nature of infrared light, explain how thunderstorms are formed and use infrared maps to predict severe weather.
Curated OER
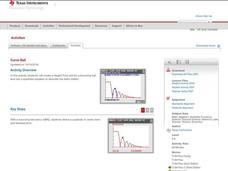
Curve Ball
Learners explore the concept of parabolas by collecting quadratic data on a bouncing ball as it is falling using a motion detector. They plot the data and determine the equation of the quadratic in vertex form, then determine the values...
Curated OER
Is the Hudson River Too Salty to Drink?
Students explore reasons for varied salinity in bodies of water. In this geographical inquiry lesson plan, students use a variety of visual and written information including maps, data tables, and graphs, to form a hypothesis as to why...
Curated OER
Garden Grid
Basically, your class reads about different garden plants from an included handout and seed packets that you provide, and then uses a grid to plan out where to place the plants. They can practice counting with the seeds, grouping,...
