Curated OER
Speed + Graphing = Winners!
Fifth graders take addition timed tests every day for a two week period. Using the data from the timed tests, they create a bar graph using Microsoft Excel computer software, a personal bar graph using graph paper and colored pencils,...
Curated OER
Let's Get Linear
Math whizzes utilize spreadsheets to examine linear modeling. They roll marbles down a ramp from three different heights and measure how far they roll. They use Excel to record their data and create a plot of their data.
Yummy Math
Diapers
Most of your students probably think a car or college is the first big expense their parents could help them with, but as it turns out these kids have been costing their parents for their whole lives. Have they ever considered how much...
Curated OER
All Choked Up By Smoking Statistics
Scholars use the article "More College Students Are Smoking, Study Says" as a springboard for discussion on the reasons why people smoke cigarettes. They investigate different methods of graphing statistics by using the data provided in...
Curated OER
Linear and Exponential Functions
This comprehensive unit on linear and exponential functions provides numerous clearly-written worksheets. Topics include graphing linear equations, solving systems of equations algebraically and by graphing, identifying the domain and...
NTTI
Line 'Em Up!
Coordinate planes and Cartesian graphing systems are the focus of this math lesson. Learners use video, internet activities, and engage in hands-on activities in order to explore coordinate planes. The materials needed for this lesson...
Texas Instruments
Is It or Isn't It Proportional
How can you tell if number relationships are proportional? Mathematicians investigate proportional relationships. They compare and contrast functions and graphs to determine the characteristics of proportional relationships, as well as...
Curated OER
Quarter, Nickel, Dime....
An engaging game called, "Quarter, Nickel, and Dime" is presented in this math lesson. Players are given an envelope with slips of paper that represent the three coins. In pairs, they play the game 18 times, and the whole class charts...
Mathematics Assessment Project
Mean, Median, Mode, and Range
What a find! Here is a lesson, designed to meet sixth grade math Common Core standards, that focuses on the calculation of different measures of center for the scores from a penalty shoot-out competition. An independent...
Sri Atmananda Memorial School
Rising Water
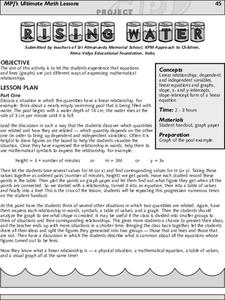
An engaging, and not to mention attractive, lesson plan has prealgebra and beginning algebra scholars examining linear relationships. They consider the rising water level as a swimming pool is being filled. They do so by charting and...
Lane Community College
Review Sheets: Trigonometry
Review guide, practice test, homework packet? Yes, yes, and yes as it's all possible with a wonderful trigonometry packet. Every type of problem is there, starting from the unit circle and ending with conic sections.
Virginia Department of Education
Middle School Mathematics Vocabulary Word Wall Cards
Having a good working knowledge of math vocabulary is so important for learners as they progress through different levels of mathematical learning. Here is 125 pages worth of wonderfully constructed vocabulary and concept review cards....
Curated OER
Hey, Pythagoras! Help Me Understand Your Theorem!
Learners explore the Pythagorean Theorem. In this math lesson, pupils solve problems using the Pythagorean Theorem. They select the appropriate numbers to substitute in the formula to solve problems.
Utah Education Network (UEN)
Insides and Outsides
Give small groups handfuls of unit cubes and then dare them to build as many rectangular prisms as possible using only 12 cubes. This engaging activity serves as an introduction to the volume of solid figures. In addition to volume,...
Curated OER
Making Money and Spreading the Flu!
Paper folding, flu spreading in a school, bacteria growth, and continuously compounded interest all provide excellent models to study exponential functions. This is a comprehensive resource that looks at many different aspects of...
Oregon Department of Education
Building and Expanding Patterns
The generation of a number, or shape pattern, is the focus of this math lesson. Pupils are presented with a variety of patterns shapes, and number patterns, then use worksheets embedded in the plan to gain further practice. The...
Curated OER
Twelve Days of Christmas--Prediction, Estimation, Addition, Table and Chart
Scholars explore graphing. They will listen to and sing "The Twelve Days of Christmas" and estimate how many gifts were mentioned in the song. Then complete a data chart representing each gift given in the song. They also construct...
Virginia Department of Education
Transformations
Geometry in life-sized dimensions! Using enlarged graph paper, pupils perform a series of transformations. By recording the initial and final placement of the images, they are able to analyze the patterns in the coordinates during a...
Inside Mathematics
Swimming Pool
Swimming is more fun with quantities. The short assessment task encompasses finding the volume of a trapezoidal prism using an understanding of quantities. Individuals make a connection to the rate of which the pool is filled with a...
Noyce Foundation
Truffles
Knowing how to scale a recipe is an important skill. Young mathematicians determine the amount of ingredients they need to make a certain number of truffles when given a recipe. They determine a relationship between ingredients given a...
Mathematics Vision Project
Module 8: Modeling With Functions
Sometimes there just isn't a parent function that fits the situation. Help scholars learn to combine function types through operations and compositions. Learners first explore a new concept with an introductory activity and then follow...
Curated OER
Data Analysis Challenge
In this data analysis worksheet, young scholars work with a partner to collect information for a survey. The information is then compiled into a graph. Students must indicate their survey question, the target audience, predict the...
National Council of Teachers of Mathematics
Eruptions: Old Faithful Geyser
How long do we have to wait? Given several days of times between eruptions of Old Faithful, learners create a graphical representation for two days. Groups combine their data to determine an appropriate wait time between eruptions.
5280 Math
Aquarium Equations
Take a look at linear functions in a new environment. A three-stage algebra project first asks learners to model the salt concentration of an aquarium using linear functions. Then, using iterations, pupils create a set of input-output...


