College Board
Frozen in Time
Take a closer look at increasing and decreasing behavior by zooming in on graphs. An AP® Calculus reference document examines how increasing/decreasing behavior should be considered in terms of intervals rather than points. The resource...
K-5 Math Teaching Resources
Clockface Template
Has the time come to begin teaching your youngsters how to read clocks? Then this resource is just for you. Including six blank analog clock faces, this worksheet challenges children to demonstrate their understanding of...
Mathematics Assessment Project
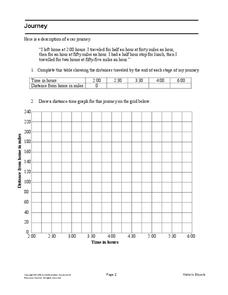
Journey
Drive home math concepts with an engaging task. Learners follow a verbal description to fill in a table and create a distance-time graph representing a car journey. They then answer questions by interpreting the graph.
Curated OER
Telling Time: Two Ways to Read the Time
Second graders discuss the two different ways of reading time. They study the vocabulary "minutes to" and tell time in five minute intervals. They discuss why it is important to have schedules and students list some schedules that they...
Common Core Sheets
Creating Clocks (Half Hour Increments)
First graders create clocks by adding hour and minute hands pointing to the given time. All times are to be written in 30-minute intervals.
Curated OER
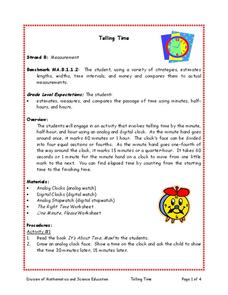
Telling Time
Students estimate, measure, and compare the passage of time using minutes, half hours, and hours. They read the book 'It's About Time, Max!' with the teacher and draw an analog clock face. They show the time and 30 minutes later, 15...
Curated OER
How Clocks Work
Students discover time pieces and complete telling time activities. For this time lesson, students complete a worksheet about what make a clock keep time. Students watch a video about time and clocks as well as a video about an Egyptian...
Curated OER
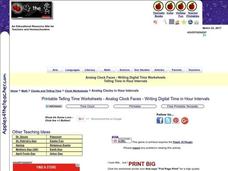
Time to Five Minute Intervals
In this time worksheet, 3rd graders practice writing time to the five minute interval using analog clock faces. They write the time on the line under each of 9 clock faces.
Lane Community College
Review Sheets: College Algebra
A jam-packed worksheet has all the topics you would teach in an Algebra II class with a variety of question styles. Starting with function notation and ending with geometric sequences, there really is something for everyone. Each...
Mathematics Assessment Project
Multiplying Cells
Powers of two: it's a matter of doubling. A short summative assessment task asks pupils to determine a process to calculate the number of cells at given time intervals. They use powers of two in order to calculate the number of...
Curated OER
Telling Time
In these math worksheets, learners master telling time on clocks using the minute hand and the hour hand. Students write the time shown as well as fill in the hands on the clock for the time that is provided below each clock.
Curated OER
What Time is It? Telling Time To Five Minutes
In this math worksheet, students analyze the time on 10 analog clocks and tell what time it is to five minutes. The hour and minute hands are different colors to help students, and there is also a clock marked with 5 minute intervals at...
Curated OER
The Effect of Math Anxiety on Cardiovascular Homeostasis
Using a pulse monitor, learners will measure a resting pulse, take a math test, and then measure the pulse again. They analyze the change in pulse and compare it to performance on the test. This multi-purpose lesson can be used in a...
Charleston School District
Increasing, Decreasing, Max, and Min
Roller coaster cars traveling along a graph create quite a story! The lesson analyzes both linear and non-linear graphs. Learners determine the intervals that a graph is increasing and/or decreasing and to locate maximum and/or...
Charleston School District
Constructing Scatter Plots
Having more letters in your name helps you get a better grade in your math class—or does it? Learners create scatter plots to organize data. The lesson places emphasis on determining scale and intervals and labeling axis.
EngageNY
Interpreting the Graph of a Function
Groups sort through NASA data provided in a graphic to create a graph using uniform units and intervals. Individuals then make connections to the increasing, decreasing, and constant intervals of the graph and relate these...
Mathed Up!
Frequency Polygons
Frequency polygons are a different way to represent frequencies over intervals. Pupils take frequencies for intervals of data from a frequency table and plot them as a frequency polygon. Budding mathematicians find information about the...
Curated OER
Plan Ahead
In this planning ahead worksheet, 3rd graders utilize a table to track Mrs. Chen's times and errands for the given day. Students word backwards to find out what time Mrs. Chen must leave the mall to complete eight errands.
Curated OER
Telling Time by the Half Hour
In this analog clocks worksheet, students draw hands on the 9 clocks to match the digital times underneath. All times are to the nearest half hour.
Curated OER
Measurement and Estimation
Students gain an understanding of time. In this time lesson, students work together to recognize the difference between yesterday, today, and tomorrow, As well as months, hours, minutes, and seconds. Students brainstorm ideas of ways the...
Curated OER
Telling Time By the Hour
In this clocks worksheet, students draw the clock hands to show the time to the hour that is printed underneath each analog clock.
Curated OER
Telling Time By the Hour
In this telling time worksheet, students analyze 9 analog clocks. Students write the correct time below each clock. All times are to the nearest hour.
Curated OER
Analog Clocks: Write the Digital Times
In this telling time worksheet, students analyze the times to the half hour on 9 analog clocks. Students write the times underneath each clock.
Curated OER
Telling Time by the Quarter Hour
In this telling time worksheet, students read the analog clocks and tell the time for each clock by the quarter hour. Students complete 9 problems.


