EngageNY
Events and Venn Diagrams
Time for statistics and learning to overlap! Learners examine Venn Diagrams as a means to organize data. They then use the diagrams to calculate simple and compound probabilities.
Curated OER
Venn Diagram
In this Venn Diagram worksheet, students read a description of a venn diagram and why they are used. Students choose two things to compare and fill in a venn diagram about their similarities and differences.
Willow Tree
Histograms and Venn Diagrams
There are many different options for graphing data, which can be overwhelming even for experienced mathematcians. This time, the focus is on histograms and Venn diagrams that highlight the frequency of a range of data and overlap of...
Curated OER
Mastering Math Vocabulary of Prime and Composite Numbers Using Venn Diagrams
Create Venn diagrams. Your class will discover the relationships between even and prime numbers. Next, they will compare that to the relationship between odd and composite numbers.
Shodor Education Foundation
Algorithm Discovery with Venn Diagrams
Here is a lesson that takes an interesting approach to analyzing data using box and whisker plots. By using an applet that dynamically generates Venn diagrams, the class forms a strategy/algorithm for guessing the rule that fits...
Shodor Education Foundation
Sets and the Venn Diagram (Beginner)
Venn diagrams are helpful in understanding the idea of a set and using attributes to sort items. This basic plan is an introduction with an added bonus of an applet that can be used to demonstrate the activity. If a classroom of...
Curated OER
Venn Diagrams
Students collect and display data in a Venn Diagram. In this statistics lesson, students collect data, compare the data and make inferences about their data. They use the Venn diagrams to identify what the data have in common and how...
National Science Teachers Association
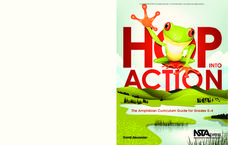
Hop into Action
Young scientists find out what makes amphibians such unique and interesting animals in this simple life science lesson plan. After looking at pictures and discussing the characteristics of amphibians, learners complete a...
Curated OER
Close Observation: Coins
Integrate math, science, and speaking/listening with a collaborative hands-on activity. Each group works with a single penny, examining it with the naked eye and recording observations. Repeat using magnifying glasses. Then repeat with a...
Curated OER
Sort It Out
Elementary schoolers engage in a game of logical reasoning called Secret Sort. A Venn diagram is used as a way to sort objects. This resource would be a great way to introduce the Venn diagram (maybe the most famous, and most-useful...
National Math + Science Initative
Introduction to Decimals
Three activities make up an introductory lesson designed to create a strong foundation in comparing fractions to decimals and exploring and building decimal models. Pupils brainstorm and complete a Venn diagram to show how decimals and...
Curated OER
Building Venn Diagrams
Students use Venn diagrams to solve prime number and factorization problems. In this multiplication lesson, students watch a video and use a Venn Diagram to help them solve a pizza math activity that uses prime factorization. Students...
Virginia Department of Education
Organizing Topic: Probability
The probability is high learning will occur! A well-designed unit introduces learners to the concepts of independent, dependent, and mutually exclusive events. Using Venn diagrams, the lessons ask learners to analyze many different...
Curated OER
Sets and the Venn Diagram
Young scholars review number sets and complete a Venn Diagram for number sets. For this number sets lesson, students review integers, whole numbers, and elements. Young scholars use computers to create a Venn Diagram for number sets....
Curated OER
Venn Diagram
Students classify items and numbers by using a Venn diagram. In this Venn diagram lesson plan, students use the computer to do this and classify pictures and numbers.
Curated OER
Venn Diagram and Shape Sorting Lesson Plan
Students use Venn diagrams to represent classifications of shapes and to use counting arguments to find the number of objects in a given set.
Curated OER
Sets an the Venn Diagram
Students explore the characteristics of sets and Venn Diagrams. Given data, students practice determining the placement of elements in a Venn Diagram. Students discuss the correspondence between data sets and their graphical...
Curated OER
Graphing and Analyzing Biome Data
Students explore biome data. In this world geography and weather data analysis lesson, students record data about weather conditions in North Carolina, Las Vegas, and Brazil. Students convert Fahrenheit degrees to Celsius degrees and use...
Curated OER
Using Diagrams in Problem Solutions
Students use tables, graphs and diagrams to collect data. In this problem solving with diagrams lesson plan, students construct their own tables and graphs containing information they gather from a drawing. They also make a Venn Diagram...
Curated OER
Venn Diagram and UK Basketball
Students analyze data and make inferences. In this algebra lesson plan, students collect and analyze data as they apply it to the real world.
Curated OER
Review - Chapters 1 & 2 Math 210: Sets
In this sets worksheet, students solve problems involving a Venn Diagram, the union of sets and subsets. They compute probability equations and solve counting problems. This one-page worksheet contains approximately 25 problems.
Curated OER
Venn Diagram
Students use a Venn diagram to show students' likes and dislikes of eggs and ham.
Curated OER
Venn Diagram Lesson Plan
Students use Venn diagrams in order to classify different objects and numbers. They then use "Venn Diagram Shape sorter" applets on the computer.
Curated OER
Gingerbread Baby v. Gingerbread Boy #7
Students read two stories. In this comparison lesson plan, students read "The Gingerbread Baby," by Jan Brett and the original "Gingerbread Boy." Students use a Venn Diagram to compare and contrast the two stories.
Other popular searches
- Venn Diagrams Math
- Venn Diagrams in Math
- Graphing Math Venn Diagrams
- Sorting Math Venn Diagrams
- Venn Diagrams & Math
- Math Venn Diagrams Shape
- Venn Diagrams Math Fractions
- Sets Venn Diagrams Math
- Venn Diagrams for Math
- Math Venn Diagrams Worksheet
- Math Venn Diagrams Graphs
- Sets and Venn Diagrams Math


