Curated OER
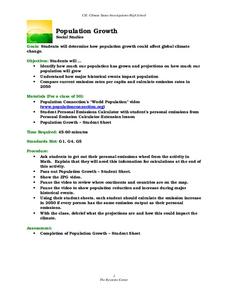
Population Growth
Students calculate human emission rate by year 2050. In this social studies lesson, students watch a video online and analyze population trends. They explain how e total emissions affect global climate.
Curated OER
The Great Race: From Anchorage to Nome
Pupils study the history of the Iditarod sled dog race. They research facts related to biology, sled dogs, and geography in order to put that history in perspective.
Curated OER
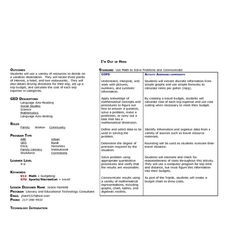
I'm Out of Here
Learners create a travel budget. In this budget activity, students research vacation destinations. Working independently, learners research destinations on the Internet and construct a budget for the vacation. Resources provided.
Curated OER
Adding Pennies, Nickels and Dimes
Students add pennies, nickels and dimes and organize the coins to display a variety of price values from real life examples. They discuss the importance of money in the day-to-day world.
Curated OER
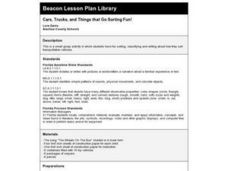
Cars, Trucks, and Things that Go Sorting Fun!
First graders sort toys by various attributes. They, in groups, sort toy vehicles by color, size etc. and then explain how they chose to group the toys. They write, draw or dictate an explanation of their sorting methods.
Curated OER
Road Trip!
Students plan a road trip, choosing destinations to visit and determining how much the trip cost. They create a journal that illustrates how they got from one place to another, and includes an expense sheet for each stretch.
Curated OER
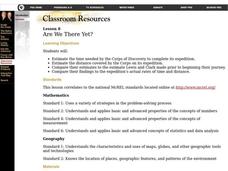
Are We There Yet?
Students estimate the time needed by the Corps of Discovery to complete its expedition. They problem solve and estimate the distance covered by the Corps on its expedition. They compare their findings to the expedition's actual rates...
Curated OER
Conveyor Belt Production
Pupils design a system that will move their glass product across a room in the plant. They must move the product 12 feet and their items cannot fall off at any time.
Curated OER
Getting There
Students practice reading a pictograph. In this data analysis lesson, students collect data and create their own pictograph. A students worksheet is included.
Curated OER
Calculating The Poverty Line
Students examine the poverty line. In this poverty line lesson, students discover what the poverty line is and how the U.S. government determines it. Students calculate alternative poverty lines and examine their implications.
Curated OER
Invest in Yourself
High schoolers develop the concept of finances. In this finance lesson, students watch a video called, "Moving Out." High schoolers calculate the finances of a character in the video. Students experience various budget scenarios such...
Curated OER
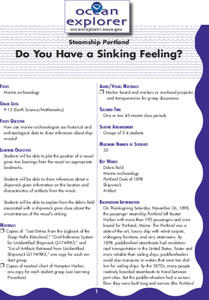
Do You Have A Sinking Feeling?
Students plot the positions of vessels given bearings in the form of landmarks. They explain how the debris field can help solve the mystery in how the ship sunk.
Curated OER
Local Traffic Survey
Students conduct a traffic survey and interpret their data and use graphs and charts to display their results.
Curated OER
Computer Graphing
Young scholars research the Internet or create surveys to find graphable data. They collect, organize, analyze and interpret the data. Finally, they choose the appropriate type of graph to display the data and find the measures of...
Curated OER
GPS Art
Students design their own logo or picture and use a handheld GPS receiver to map it out. They write out a word or graphic on a field or playground, walk the path, and log GPS data. The results display their "art" on their GPS receiver...
Curated OER
Houses and Cars and Loans
Students create a spreadsheet to track their spending. In this algebra lesson, students use loan formulas to calculate the payback amount plus interest on a loan. They calculate how much money they would need to buy a car and house.
Curated OER
Evergreen's Green Team Energy Audit
Students investigate the ways energy is used at their school and how it can be changed. In this energy lesson plan, students participate in a service project related to energy. Students record and calculate changes that saved...
Curated OER
Risk Assessment and Geometry
Tenth graders study the concept of risk analysis as it relates to geometry. In this spatial relationship lesson, 10th graders are provided a set of coordinates to analyze a piece of land described. Students write a description that...
Curated OER
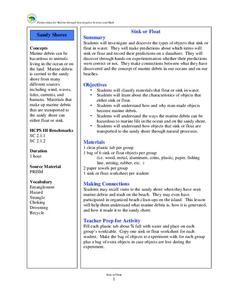
Sink or Float
Students explore water properties by conducting a class experiment. In this buoyancy lesson, students make predictions as to whether or not specific objects will sink or float in water. Students conduct the experiment and record their...
Curated OER
Immigration in the United States
Learners examine the reasons why people leave their country to live in another. In groups, they use print and electronic resources to answer questions about where immigrants came from during different time periods and advice given to...
Curated OER
Boat Design
Young scholars build a boat and make predictions. In this geometry lesson, students design a cargo boat. They must show that the boat they designed can carry the cargo.
Curated OER
The Designed World
Students manage and retrieve numbers and letters that are logically sorted. In this logical information lesson plan, students do the flood game from the PBS website. Students answer questions about library books.
Curated OER
African Safari
Learners create an Excel spreadsheet that show a budget for a trip to Africa to see wildlife. In small groups, they complete internet research to determine the countries and sites to visit then calculate the costs involved for the trip....
Curated OER
Bridges: Local, National and Global Connections
Fifth graders examine the role of bridges in commerce and transportation. They create a schedule for building a bridge and how much money it would take to build one.
