Curated OER
Relating Distance and Velocity Over Time
Students calculate the distance and velocity over time. In this algebra lesson, students graph a linear function to represent the distance vers time travel. They interpret their graphs and draw conclusion.
Curated OER
Mathematical Magazines
Young scholars look through magazines and calculate the percentages of the types of ads in the magazines. In this percentages lesson plan, students create a graph to show their results.
Curated OER
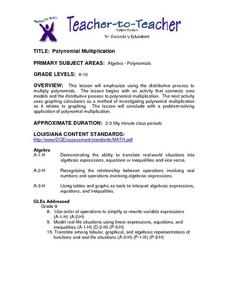
Polynomial Multiplication
Students review information about how to multiply polynomials and then work in pairs to complete a worksheet. They use graphing calculations to help them solve their math problems.
Curated OER
Playing with Money (From the New Zealand Point of View)
Young scholars explore the exchange rates for five countries. They identify the units of currency of a number of countries. Students convert money amounts accurately from New Zealand dollars to another currency. They graph currency...
Curated OER
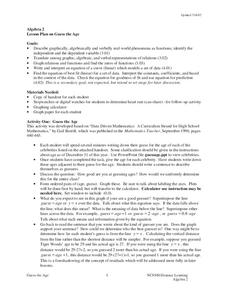
Guess the Age
Learners explore functions using real world application. In this algebra lesson, students play a game as they apply concepts of function. They graph their findings and discuss it with the class.
Curated OER
Race The Rapper: Slopes
Students calculate the slope of the equation In this algebra instructional activity, students graph coordinate pairs of linear equations and identify the relationship between x and y values and slope. They differentiate between...
Curated OER
Linear Systems
Students solve and graph linear equations. In this algebra lesson, students solve systems of equations using elimination and substitution. They graph their answer and identify the point of intersection.
Curated OER
How Much Will I Spend On Gas?
Students construct a linear graph. In this graphing lesson, students determine a monthly budget for gasoline. Students construct a t-chart and coordinate graph to display data. Resources are provided.
Curated OER
How Do You Feel Today?
Students create a graph, then listen to Dr. Seuss' book, My Many Colored Days. After the story, they do a similar graph and then compare the two graphs.
Curated OER
Discovering Shoes, Step by Step
Learners discuss and write about their interpretations of the art. They compare and contrast the numerous types of shoes and how they are used in a certain time and place. Students memorize the Shel Silverstein's poem, "Ickle Me, Pickle...
Curated OER
Jelly Belly: What a Wonderful "Bean"!
Students explore how jelly beans are produced. They discuss the origins of the jelly bean and view a video about how jelly beans are prepared, tested, shaped, finished, and shipped and estimate the amount of jelly beans in a jar and sort...
Curated OER
Mathematical Magazines
Students classify and tabulate the type of advertisements found in a collection of magazines. Determination is made on what percent of the total number of ads each type represents. They present their results orally and in a graph.
Curated OER
POWER OF VOTING
Fifth graders explain the process of a national presidential election by researching through the Internet and holding an election simulation. They collect, graph, and interpret election data. They enhance their computer skills by...
Curated OER
Statistics: Misleading or Accurate?
Learners explore the concept of misleading statistics. In this misleading statistics lesson, students play a game of tag and graph the number of times each student gets tagged. Learners use the graph to determine the fastest runner in...
Curated OER
Putting Your Money to Work
Learners create a collect data on expenses. In this algebra lesson, students create a spreadsheet to solve scientific equations. They incorporate math, science and technology in this lesson.
Curated OER
When Am I Ever Going to Use this?
Students solve problems using equations and properties of integers. In this algebra lesson, students solve problems using ratio and proportion and graph their answers on a coordinate plane. They solve word problems using geometry.
Curated OER
Absolute Maximum and Minimum
Students calculate the maximum and minimum of each function. In this algebra lesson, students collect and graph data to analyze it. They differentiate between the absolute max and min and the maxima and minima of each function.
Curated OER
Real World Systems of Linear Equations
Students solve systems of equations with fluency. In this algebra lesson, students graph, use elimination and substitution to solve systems of equations. They identify the point of intersection using algebra.
Curated OER
Homecoming Tickets
Students solve word problems using systems of equation. In this algebra lesson plan, students use computer and graphing to graph and analyze their solution. They solve system involving inequalities.
Curated OER
Moving Straight Ahead
Students analyze the relationship between speed, time and distance. In this math lesson, students plan a school trip. Students determine the efficiency and cost effectiveness of a trip.
Curated OER
Scientific Notation II: The Mantissa
Students after completing the Part II (of 2) scientific notation online lab exercises, manipulate and interpret large numbers expressed in the "mantissa and exponent" format of scientific notation.
Curated OER
Scientific Notation I: The Exponent
Students manipulate and interpret large numbers expressed in the "exponent" format of scientific notation.
Curated OER
Water in the Texas Coastal Basins
Learners, after researching a Texas coastal basin, map and graph the information they collect and then translate it into a short report to be presented to their classmates. They brainstorm unique ways to maintain Texas estuaries as well...


