EngageNY
Linear and Exponential Models—Comparing Growth Rates
Does a linear or exponential model fit the data better? Guide your class through an exploration to answer this question. Pupils create an exponential and linear model for a data set and draw conclusions, based on predictions and the...
EngageNY
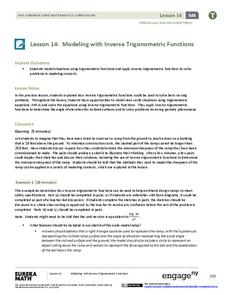
Modeling with Inverse Trigonometric Functions 2
Use inverse trigonometric functions to work with ramps, rabbits, and Talladega. The class models real-world situations with trigonometric functions and solves them using inverses in the 15th installment of a 16-part series. Pupils solve...
Balanced Assessment
Catenary
Develop a model for a hanging chain. Pupils find a mathematical model for a hanging chain and then they compare their models to the precise function that models the curve. Scholars come up with a strategy to determine how close their...
CCSS Math Activities
Smarter Balanced Sample Items: 7th Grade Math – Claim 4
Build the model right out of the box. A few sample items show teachers how Smarter Balanced assessments may approach Claim 4, modeling and data analysis. Pupils use their skills to create equations or expressions to model the situation...
Radford University
Mathematical Modeling: Lesson 1
Will more deer result in more big game licenses? Scholars first research data on the number of deer and the number of big game licenses in Virginia between 1990 to 2009. They apply polynomial, exponential, and logarithmic regression to...
Mathalicious
XBOX Xpotential
Touchdown! This is an exponentially insightful lesson that explores the growth of football games with different video game consoles. Class members discuss whether the increase of mergahertz can be described as linear or exponential. The...
Mathalicious
The Fall of Javert
Falling off a bridge might not sound like your idea of a good math problem, but incorporating the final scene of Les Misérables is sure to spark interest. The goal is to use the time Javert fell off the bridge to determine how high he...
EngageNY
Analyzing a Data Set
Through discussions and journaling, classmates determine methods to associate types of functions with data presented in a table. Small groups then work with examples and exercises to refine their methods and find functions that work to...
EngageNY
Modeling with Polynomials—An Introduction (part 1)
Maximizing resources is essential to productivity. Class members complete an activity to show how math can help in the process. Using a piece of construction paper, learners construct a box with the maximum volume. Ultimately, they...
EngageNY
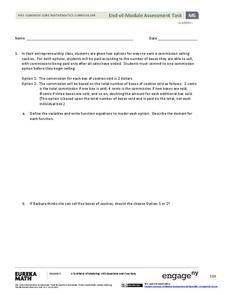
End-of-Module Assessment Task - Algebra 1 (Module 5)
This unit assessment covers the modeling process with linear, quadratic, exponential, and absolute value functions. The modeling is represented as verbal descriptions, tables, graphs, and algebraic expressions.
EngageNY
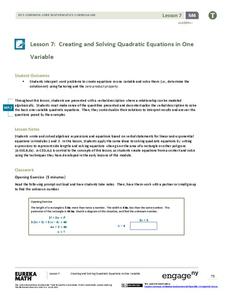
Creating and Solving Quadratic Equations in One Variable
Give your classes practice at modeling using quadratic models with a resource that uses area and integer problems to allow individuals to create second degree polynomials. Young mathematicians solve equations using factoring and then...
EngageNY
Analyzing Residuals (Part 1)
Just how far off is the least squares line? Using a graphing calculator, individuals or pairs create residual plots in order to determine how well a best fit line models data. Three examples walk through the calculator procedure of...
EngageNY
Graphs of Quadratic Functions
How high is too high for a belly flop? Learners analyze data to model the world record belly flop using a quadratic equation. They create a graph and analyze the key features and apply them to the context of the video.
Curated OER
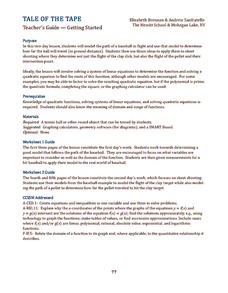
Tale of the Tape
How can baseball and skeet-shooting be modeled mathematically? Sports lovers and young mathematicians learn how to use quadratic equations and systems of equations to model the flight paths of various objects.
EngageNY
Comparing Quadratic, Square Root, and Cube Root Functions Represented in Different Ways
Need a real scenario to compare functions? This lesson has it all! Through application, individuals model using different types of functions. They analyze each in terms of the context using the key features of the graphs.
Curated OER
Skate Party
Learners use the Frayer model during problem solving. For this problem solving lesson, they examine multiple methods of data collection to solve real world problems. Resources are provided.
EngageNY
The Multiplication of Polynomials
If you can multiply multi-digit integers, you can multiply polynomials. Learners use an area model to compare multiplying numbers to multiplying polynomials. They progress to using the distributive property.
EngageNY
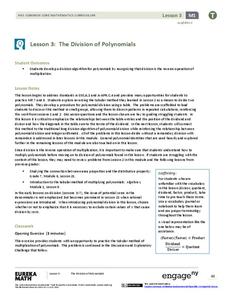
The Division of Polynomials
Build a true understanding of division of polynomials. Learners use their knowledge of multiplying polynomials to create an algorithm to divide polynomials. The area model of multiplication becomes the reverse tabular method of division.
Illustrative Mathematics
Naming the Whole for a Fraction
How many different ways can you represent a whole? In a picture that represents six parts (two of which are shaded), learners are asked to label the parts appropriately to show how three different mathematical interpretations can be...
Illustrative Mathematics
Logistic Growth Model, Abstract Version
Here learners get to flex some serious algebraic muscles through an investigation of logistic growth. The properties of the constant terms in the logistic growth formula are unraveled in a short but content-dense activity. Moving...
Curated OER
Representing Fractions, Decimals, and Percents
In this fractions, decimals, and percents lessons, students explore various methods of representing fractions. They demonstrate situations that represent rational numbers. Students create a foldable exploring fractions, decimals and...
Alabama Learning Exchange
Ice Fishing is for the Birds
Approach addition with young mathematicians in an engaging way through this penguin-inspired activity. In small groups, scholars think about times they have used addition in their real lives (there are some suggestions given), then watch...
Curated OER
Mt. Whitney to Death Valley
This is an intriguing problem that brings together real-world data, technology, and mathematical problem solving. If visibility wasn't an issue, could you see from the highest point in the lower 48 states, Mt. Whitney, to the lowest...
Curated OER
The Mathematical Fingerprint of Our Solar System
Learners study the beautiful mathematical model unique to our solar system.
Other popular searches
- Mathematical Models Budget
- Creating Mathematical Models
- Camp Mathematical Models
- Cmp Mathematical Models


