EngageNY
The Distance from a Point to a Line
What is the fastest way to get from point A to line l? A straight perpendicular line! Learners use what they have learned in the previous lessons in this series and develop a formula for finding the shortest distance from...
EngageNY
Volume of Composite Three-Dimensional Objects
Most objects have irregular dimensions — you have to find them! Teach your class how to find the volume of composite objects that can be decomposed into prisms. Objects get increasingly more complex as the lesson progresses.
EngageNY
The Most Famous Ratio of All
Pupils develop a definition of a circle based upon its radius in the 17th segment of a 28-part series. They determine the relationship between the radius and the diameter of a circle. To round out the instructional activity, they use the...
Curated OER
Writing Equations
In this writing equations worksheet, 9th graders solve and complete 20 different problems that include writing an equation and finding a solution for each problem. First, they read the problem through and write an equation that best...
Illustrative Mathematics
Latitude
The greater the latitude, the less of the Earth is north. Scholars graph the relationship between the latitude and the percentage of the Earth that is north of the latitude. Using the graph and the table, class members interpret values...
Curated OER
Play It
There are a number of activities here that look at representing data in different ways. One activity, has young data analysts conduct a class survey regarding a new radio station, summarize a data set, and use central tendencies to...
Curated OER
What's Your Average? What Do You Mean? I'm More Than Just Average
Upper grade and middle schoolers collect data, analyze and interpret the data. This three-part activity should provide learners with a firm understanding about the differences between mean, median, and mode and how to perform the...
Curated OER
Principles of Flight: Flying Paper Airplanes
Students investigate ways to enhance an object's flying ability. In this model construction instructional activity, students construct two paper airplanes, one of which is twice as big as the first. Students compare and...
Curated OER
American Journeys: Right Place, Right Time
Sixth graders measure distances on a map using string and a ruler. They complete mathematical word problems about measurement.
Curated OER
Solving Problems Using Triangle Inequality Theorem
Sixth graders investigate triangles and the inequality theorem. They will collaborate in groups to determine the length of a longest side of a triangle. Then relate the size of the triangle to its angles using protractors, yard sticks,...
Curated OER
Operations with Signed Numbers
Learners complete a variety of activities to comprehend concepts of operations with signed numbers. The integration of technology make the delivery of the instructional activity much more exciting for Students.
Curated OER
Design Space
Students will develop an understanding design space. The arrangement of shapes is taught to create simple perspective. The differences in the size of shapes is shown in order to help learners see how they should be arranged in...
Curated OER
Searching for Angles and Lines
Students work to find and reinforce concepts related to lines and angles. They identify the characteristics of shapes that have one, two, and three dimensions. The students also work on definitions related to the geometry of shapes.
Curated OER
Workshop Lesson: Digital Camera
Students perform an activity in small groups in order to investigate different types of shapes found in photographs taken with a digital camera. The integration of technology is used to engage students in the lesson.
Curated OER
Area and Perimeter Quiz
For this mathematics worksheet, students give the area and perimeter of each polygon illustrated on the sheet. There are six different polygons to measure on the sheet.
Curated OER
Mean, Median and Mode
Young statisians work with sets of data. They find mean, median and mode, and discuss the effects of outliers on the data set.
National Wildlife Federation
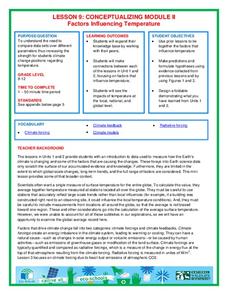
Conceptualizing Module II - Putting It All Together
"Creativity is just connecting things." - Steve Jobs. After weeks of researching climate change, the ninth lesson plan in a series of 21 combines the data and analysis to address essential questions. It covers natural phenomenon,...
National Wildlife Federation
Why All The Wiggling on the Way Up?
Some of the CO2 emitted by burning fossil fuels is removed from the atmosphere by natural sinks, such as the ocean. The fifth engaging lesson in the series of 21 examines the CO2 data from three very different locations. It then makes a...
National Wildlife Federation
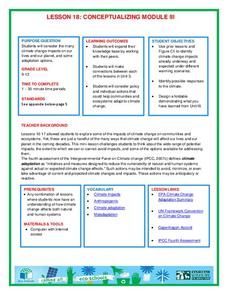
Conceptualizing Module III
Many researchers focus on one impact of climate change in isolation, but researchers gain a global perspective when they come together. A timely instructional activity teaches scholars about the projected impacts of global temperature...
National Wildlife Federation
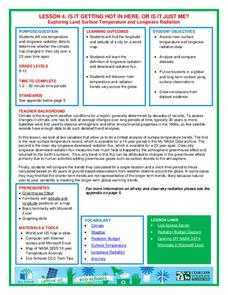
Is It Getting Hot in Here, or Is It Just Me?
Currently, only 2.1% of global warming is felt on continents, while over 93% is felt in the oceans. The fourth lesson in the series of 21 on global warming is composed of three activities that build off one another. In the first...
National Wildlife Federation
The Tide is High, but I’m Holding On… Using ICESat Data to Investigate Sea Level Rise
Based on the rate of melting observed from 2003-2007 in Greenland, it would take less than 10 minutes to fill the Dallas Cowboys' Stadium. The 17th lesson in a series of 21 has scholars use the ICESat data to understand the ice mass...
Curated OER
Graph Your Foot!
Students measure their own foot and place the outline on a graph. They make connections between the size of their foot and the bar graph that represents it.
Pennsylvania Department of Education
What's My Height?
Students explore geometry by conducing a student measurement activity. In this height instructional activity, students identify their own height by utilizing a tape measure and marking their height on a wall. Students identify their...
Curated OER
"How Tall, How Short, How Faraway" by David A. Adler
Students list in a journal what "measurement" is. They measure with standard and non-standard units and record data on a class chart. They also construct a meter tape.


