Curated OER
Commutative, Associative, and Distributive Properties
Young scholars explore the concept of the associative, commutative, and distributive properties. In the associative, commutative, and distributive properties lesson, students discuss real world examples of each property. Young scholars...
Curated OER
The Bell Curve
Learners are introduced to the concepts of the normal curve, skewness and the standard deviation. They discuss how the normal distribution has been used and misused to support conclusions.
Curated OER
Property Posters
Students identity properties of addition and multiplication. For this addition and subtraction properties lesson, students explore commutative, associative, and distributive properties as they design posters that feature the properties...
Pennsylvania Department of Education
Multiplication Using Arrays
Explore the concept of multiplication by using arrays. Classmates use arrays to gain a better understanding of multiplication. They break arrays apart to model the distributive property of multiplication over addition. The relationship...
Curated OER
Empirical Rule Practice Problems
Using the empirical rule for a normal distribution, young statisticians determine the percent of adult women with given heights and weights. They find the percentile rank of a woman of a stated height and find the area under a curve.
Curated OER
Making Sense of the Census
Learners problem solve the mean and median of agricultural data by completing a worksheet. They discuss the results of the statistical data.
EngageNY
Sampling Variability in the Sample Mean (part 1)
How accurate is data collected from a sample? Learners answer this question using a simulation to model data collected from a sample population. They analyze the data to understand the variability in the results.
EngageNY
Using Sample Data to Compare the Means of Two or More Populations II
The 23rd segment in a series of 25 presents random samples from two populations to determine whether there is a difference. Groups determine whether they believe there is a difference between the two populations and later use an...
Illustrative Mathematics
The Sign of Solutions
Positive or negative, zero or no solution, are all possibilities for the solution of a linear equation. Here the resource gives examples of linear equations in one variable and their type of solutions. The resource comes with commentary...
CK-12 Foundation
Mode: Boxes of Oranges
See how your data stacks up. Pupils stack crates of oranges in increasing order, creating a simple bar graph. Using the graph, individuals determine measures of center and describe the shape of the distribution. Scholars determine what...
Mobile Education Store
PrepositionBuilder™
Prepositions can change the meaning of a sentence and children need to know how to use them properly. Here is an app that has been designed with the struggling learner in mind. It uses visual and audio cues to help elementary-aged...
Curated OER
Mean, Variance, and Standard Deviation for the Binomial Distribution
Students review previous lessons on mean, variance, standard deviation, and expected value. They utlize formulas for these characteristics that are specifically designed for the binomial distribution. Students discuss the similarities...
Curated OER
Mean and Standard Deviation
Get two activities with one lesson plan. The first lesson plan, is appropriate for grades 6-12 and takes about 20 minutes. It introduces the concept of measures of central tendency, primarily the mean, and discusses its uses as well as...
Curated OER
What Does Success Mean to Me?
One can't set goals until he knows what he needs to feel successful. Learners discuss what they believe it means to be successful. They then fill out a graphic organizer showing four different paths to a successful adult life.
Curated OER
Partner Problems: Linear Equations and Inequalities
In pairs, learners solve linear equations. This worksheet contains two pages and ten multi-step linear equations for each student to solve. Which means there is a total of 20 problems.
Shodor Education Foundation
Overlapping Gaussians
Adjust the overlap to compare probabilities. Using sliders, learners adjust the shape of two Gaussian curves. The interactive calculates the area of the left tail for one curve and the right tail for the other. Pupils set the interactive...
Curated OER
Sampling Distributions
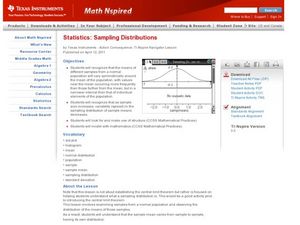
Students analyze sampling from different population. In this statistics lesson, students define the meaning of sample sizes and what causes an increase or decrease. They graph their data on the Ti calculator and draw conclusion from the...
Curated OER
What Happened to the Mean and Median
Students find the mean, median and mode. In hs statistics lesson, students collect, plot and analyze data. The identify the effect the central tendency have on the data and line.
Curated OER
Math Words with Multiple Meanings
Learners of many ages use the Visual Thesaurus to help them understand the language of math. They work in groups to explore the multiple meanings of common math terms. Pupils come up with examples of the words in mathematical and other...
Curated OER
What Can Data Tell Us?
Students explore data distribution. In this data analysis lesson, students create a data distribution table by playing the game "Tower of Hanoi" from the Hall of Science. Students analyze their data and answer data driven questions.
Curated OER
A Day of Infamy:Analyzing FDR’s Pearl Harbor Address
In 1941 FDR spoke out on the events at Pearl Harbor. The class will get to analyze word choice, word meaning, author's craft and structure by analyzing an actual draft of this speech. They will look critically at the words used,...
Curated OER
Frequency Distributions and Measures of Central Tendency
Twelfth graders use the Internet to research information on NFL players and construct frequency distributions from the data. They calculate the mean, medium and analyze their data.
Curated OER
4 Discrete Probability Distributions
Students read and complete problems on how to solve discrete probability distributions. In this probability distributions lesson plan, students read math problem examples and solve them.
Curated OER
Central Tendency
In this central tendency activity, 8th graders solve 10 different problems that include determining the mean, mode, and median of various situations. First, they prepare a frequency distribution with a class interval for the data found...


