Curated OER
Fixed Distance
In this fixed distance worksheet, 10th graders solve 10 different problems that include determining the fixed distance from a particular point. First, they determine the locus of points inches from a specific point. Then, students write...
Curated OER
Prairie Dogs: Finding the Balance
Students study about prairie dogs and determine the mean, median, and mode of a prairie dog tow's population.
Curated OER
Sales Leader
Students examine a set of data based on a realtor's sales for a specific amount of time. Using this information, they calculate the mean, mode and median and how to skew the data to different points of view. They determine which...
Curated OER
Data Days
Sixth graders practice collecting, organizing and displaying data. They create circle, bar, line and picto graphs. They analyze data in small and large sample groups.
Curated OER
Slopes, Hopes, & Speed
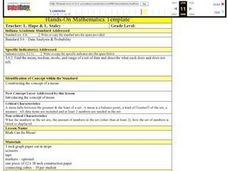
Students investigate the sport of skiing through Internet research in this multi-task lesson. They compare and generalize the results of five individuals by using mean, median, and mode.
Curated OER
Mean, Median, and Mode
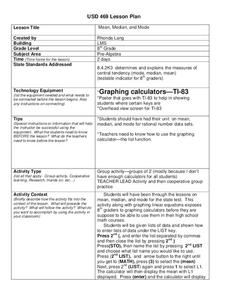
Eighth graders practice using the LIST key on graphing calculators using the proper syntax. They work with the functions of mean, median, and mode in a teacher led lesson and then with a partner on a second data set. They follow...
Curated OER
Bones and Math
pupils identify and explore the connection between math and the bones of the human body. Students collect data about bones from their classmates and from adults, apply formulas that relate this data to a person's height, and organize and...
Curated OER
Shooting Stats
Eighth graders discover the important role statistics play in sports and that appropriate data must be collected to do a statistical analysis. Students practice calculating statistics by charting a professional player of their choice.
Curated OER
Average
In this number averages worksheet, students review how to find the average of a given set of numbers. Students then complete three word problems by averaging numbers.
Curated OER
Stem-and-Leaf Plots
Students are introduced to stem-and-leaf plots and calculating the mean, median, and mode from the plots.
Curated OER
The One in the Middle
Students review and reinforce the concepts of mean, median, and mode based on the number of siblings the students have. They use Post-it notes to organize and re-organize the data.
Curated OER
Math Can Be Mean!
Fifth graders are introduced to the topic of means. Calculating the mean, mode and median, they describe what each set of numbers tell and do not tell about the data. They use a line graph to practice finding the mean. They also use...
Curated OER
Fly Away With Averages
Pupils discover the process of finding the mean, median, and mode. Through guided practice and problem solving activities, they use a computer program to input data and create a graph. Graph data is used to calculate the mean, median,...
Curated OER
Data Analysis
Students examine techniques to represent data. In this data analysis lesson, students read about various ways to represent data, such as a stem and leaf diagram and calculating standard deviation. Students complete data analysis...
Curated OER
Average Looking
Students use measurements of their classmates to find the average (means and modes) of their facial features. They use their findings to create a three-dimensional "class head." Examples and assessment materials are included.
Curated OER
Let's Graph It!
Students graph the height of others in centimeters and inches, find the slope of line in order to calculate the conversion factor between centimeters and inches.
Willow Tree
Mean, Median, and Mode
Statistics are more than just numbers—they can give you important information about a set of data. Pupils learn how to find the mean, median, and mode of a data set. They also find the next score to reach a desired mean.
Willow Tree
Extremes, Range, and Quartiles
The middle of the data is important, but what about the rest of it? The instructional activity shows learners the importance of the range, quartiles, and extreme values. Pupils practice finding each of these values from given data sets.
Virginia Department of Education
Organizing Topic: Data Analysis
Learners engage in six activities to lead them through the process of conducting a thorough analysis of data. Pupils work with calculating standard deviations and z-scores, finding the area under a normal curve, and sampling techniques....
Curated OER
The Power of Graphical Display: How to Use Graphs to Justify a Position, Prove a Point, or Mislead the Viewer
Analyze different types of graphs with learners. They conduct a survey and determine the mean, median and mode. They then identify different techniques for collecting data.
Willow Tree
Box-and-Whisker Plots
Whiskers are not just for cats! Pupils create box-and-whisker plots from given data sets. They analyze the data using the graphs as their guide.
Curated OER
Penny Basketball: Making Sense of Data
Explore four web-based interactive sites to develop a baseline understanding of statistics. Learners play a series of penny basketball games and collect data regarding their shooting statistics. Groups decide who is the "top" penny...
Curriculum Corner
Guest Teacher Plans: Grade 6
Taking a day off of school can feel like a lot more work than going because of the time and effort that goes into making sub plans. Make your life easier with a daily plan for a guest teacher designed to meet the needs of sixth graders...
Curated OER
Application and Modeling of Standard Deviation
The first activity in this resource has learners computing the mean and standard deviation of two different data sets and drawing conclusions based on their results. The second activity has them using a dice-rolling simulation to...


