Curated OER
Linear Programming
For this algebra worksheet, students calculate the maximum and minimum of a shaded region. They identify the boundaries and their vertices's. There are 2 problems.
Curated OER
Power Walk and Jog
Throw in something different for your runners to focus on while they walk, jog, or run for five and a half minutes. Each time the runner passes you, hand them a playing card. There are several ideas on how to use them as motivators:...
EngageNY
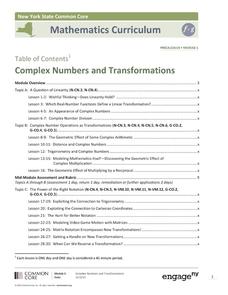
Complex Numbers and Transformations
Your learners combine their knowledge of real and imaginary numbers and matrices in an activity containing thirty lessons, two assessments (mid-module and end module), and their corresponding rubrics. Centered on complex numbers and...
Willow Tree
Line Plots
You can't see patterns in a jumble of numbers ... so organize them! Learners take a set of data and use a line plot to organize the numbers. From the line plot, they find minimum, maximum, mean, and make other conclusions about the data.
Balanced Assessment
Triangle in Circle
Even kindergartners can draw triangles in circles, but the assessment task requires a bit more geometric knowledge. Scholars investigate triangles that have a diameter of a circle as one of its sides. They must consider triangles that...
Shmoop
Functions Worksheet 5
To the point and deeper thinking are both types of questions included in the worksheet. Begin the practice of solving quadratics and then finish with five questions asking quadratic and exponential application problems.
Curated OER
Representing Data 2: Using Box Plots
What information can be gleaned from a box and whiskers plot? Discuss the five summary values - minimum, maximum, upper and lower quartiles, and median - and what conclusions can be made from these values? Included here is a matching...
Illustrative Mathematics
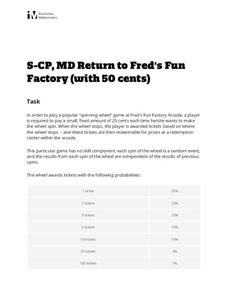
Return to Fred's Fun Factory (with 50 Cents)
The penny arcade gets the statistics treatment in this fun probability investigation. A non-standard game of chance is described and then the class is set loose to find missing probabilities, determine common outcomes, and evaluate...
Virginia Department of Education
Box-and-Whisker Plots
The teacher demonstrates how to use a graphing calculator to create box-and-whisker plots and identify critical points. Small groups then create their own plots and analyze them and finish by comparing different sets of data using box...
Howard County Schools
Planning for Prom
Make the most of your prom—with math! Pupils write and use a quadratic model to determine the optimal price of prom tickets. After determining the costs associated with the event, learners use a graph to analyze the break even point(s).
Curated OER
Flammable and Combustible Liquids
Students complete the required topics for the OSHA 10-hour course. They are presented with Flammable and Combustible Liquids. Students define the following tems: flash point, flammable liquid, and combustible liquid. They are explained...
Curated OER
Extreme Values
Students sketch a picture of what appears on a computer screen. Locate the extreme points on the pictures and label them as maxima or minima. Use the definitions of maxima and minima to explain how you identified the points indicated, if...
Curated OER
Creating Line Graphs
Learners relate data to coordinate graphs and plot points on this graph. They use minimum wage data to construct the graph. Students decide appropriate time intervals for the graphs. They share graphs with their classmates.
Curated OER
Quiz 7: Multivariable Calculus
Test your students' calculus skills with this quiz, the first page of which includes instructions and an honor pledge. On the second page, students find the maximum and minimum values of the of an identified figure with given...
Curated OER
Graphing Polar Equations
For this graphing polar equations worksheet, students solve and complete 10 various types of problems. First, they construct a table of values using the special angles and their multiples. Then, students plot the points in the table on a...
Mathematics Assessment Project
Representing Quadratic Functions Graphically
Sometimes being different is an advantage. An engaging activity has scholars match cards with quadratic functions in various forms. Along the way, they learn about how each form highlights key features of quadratic functions.
Mathematics Vision Project
Module 6: Quadratic Functions
Linear, exponential, now it's time for quadratic patterns! Learners build on their skills of modeling patterns by analyzing situations with quadratic functions. The sixth module in the Algebra I series has pupils analyze multiple...
Curated OER
Three Methods for Using Quadratic Functions to Model Data
In this modeling data learning exercise, students use quadratic functions to model data using three different methods. This learning exercise provides explanations and an example. Additionally, students are given the steps to find the...
Curated OER
Worksheet 26 - Function
In this function worksheet, students identify the local maximum and minimum values and angle dimensions. This one-page worksheet contains six multi-step problems.
Curated OER
Graph of a Function
In this graph of a function worksheet, students graph a function and find the value at a given point. They determine the absolute minimum and maximum of an interval. This two-page worksheet contains three problems.
Curated OER
Debate on China's One Child Policy
High schoolers learn about China's One Child Policy. They read an article about a specific family's experience under the policy (not included) and research and explain the key points of the policy. They assess the pros and cons in a...
Curated OER
Let's Count! (Teachers' Page)
Learners practice counting using a website "Let's Count". They point to each object and count and pull down a tab to check their answers.
Curated OER
Inflation and Unemployment
Twelfth graders are introduced to the relationship between inflation and unemployment. They define the employment and unemployment rate and practice calculating the figures. Analyzing minimum wage laws, they model a process for...
Curated OER
Mountain Biking - Lesson 3 - Starting Up a Steep Hill
Knowing how to start up a steep hill while mountain biking is a good skill to have. Otherwise, if one stoppped part way up and couldn't get started up again, what would be the point. This lesson offers up some good cues in getting set to...


