Mathematics Vision Project
Module 5: Modeling with Geometry
Solids come in many shapes and sizes. Using geometry, scholars create two-dimensional cross-sections of various three-dimensional objects. They develop the lesson further by finding the volume of solids. The module then shifts...
Charleston School District
Pre-Test Unit 9: Scatter Plots
What do your classes know about statistics? Use a pre-test to determine their background. Topics include scatter plots and lines of best fit, two-way frequency tables, and modeling with linear equations.
Virginia Department of Education
Quadratic Curve of Best Fit
Class members create a table of the number of chords that can be drawn given the number of points on a circle. Pupils analyze the data created, find a function to fit to it, and use the function to make further predictions.
Inside Mathematics
Vencent's Graphs
I like algebra, but graphing is where I draw the line! Worksheet includes three multiple-part questions on interpreting and drawing line graphs. It focuses on the abstract where neither axis has numbers written in, though both are...
Curated OER
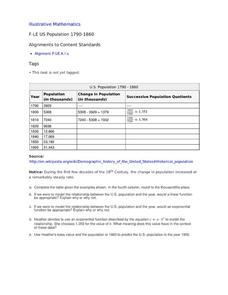
US Population 1790-1860
Your young population scientists analyze a table of values, write a model to represent the real life data, finish the table of data and predict future populations in a collaborative, real-life activity.
Kenan Fellows
Half-Life
Scholars shake their way to understanding half-life with the help of candy. They observe and record which side candy lands on to graph the exponential decay in the fifth instructional activity of seven integrating chemistry and algebra....
Curated OER
Amusement Park Physics
Students get up close and personal with principles of motion. In this physics lesson, students collect and analyze acceleration data on amusement park rides. Students use CBLs to collect data in this lesson.
Curated OER
Modeling Population Growth
Students collect data on population growth. In this statistics lesson, students graph their data and make predictions. They find the linear regression and the best fit line.
Curated OER
Absolute Value of Linear Functions
Learners identify and interpret how absolute value affects linear functions. They also graph linear functions and reflect them in a line of symmetry. Finally, students evaluate the absolute value of a constant using technology to...
Curated OER
Interpreting Graphs
Sixth graders interpret linear and nonlinear graphs. They create graphs based on a problem set. Next, they represent quantitive relationships on a graph and write a story related to graphing.
Curated OER
Y-Intercept and Slope Intercept Form
Alegebra amateurs identify the slope and the y-intercept given a linear equation in slope-intercept form by correctly completing some in class problems. They write the linear equation in slope-intercept form that corresponds to the given...
Curated OER
Lesson 6-7: Scatter Plots and Equations of Lines
In this scatter plot worksheet, students examine tables and write a linear equation that matches the table. Students graph linear equations. They read scatter plots, determine the trend line, and write a linear equation to...
Curated OER
Graphing Data from the Chemistry Laboratory
Students graph and analyze data using a spreadsheet.
Curated OER
Graphing Real World Situations
Students solve linear equations using graphs. In this algebra instructional activity, students depict real life situation using lines and functions. They identify the slope, data and predict graphing behavior.
Illustrative Mathematics
Bike Race
A graph not only tells us who won the bike race, but also what happened during the race. Use this resource to help learners understand graphs. The commentary suggests waiting until the end of the year to introduce this topic, but why...
Curated OER
Wrapping It All Up
Through learning how to examine linear, quadratic, and exponential functions, young scholars explore the effects of changes in parameters on the graphs of linear, quadratic, and exponential functions. The lesson is designed to be a...
Curated OER
Which Method Will You Choose? Finding Solutions to Systems of Equations.
Ninth graders investigate systems of linear equations. In this Algebra I lesson, 9th graders determine which method is the best for solving a systems: graphing, substitution, or elimination. Students choose...
PBL Pathways
Medical Insurance 3
Create a technical report explaining the components of a medical plan through a function. The project-based learning activity gives a medical insurance scenario that young mathematicians model using piecewise functions. Their analyses...
101 Questions
Coins in a Circle
Round and round you'll go! Learners watch as different-sized circles fill with coins. They collect data and then make a prediction about the number of coins that will fit in a large circular rug.
American Statistical Association
How Tall and How Many?
Is there a relationship between height and the number of siblings? Classmates collect data on their heights and numbers of brothers and sisters. They apply statistical methods to determine if such a relationship exists.
Illustrative Mathematics
Households
Use an inverse linear function to interpolate a point. Presented with the number of households over a period of year, pupils find a linear function that will be a model. Class members determine the inverse of the linear function and use...
Howard County Schools
Generous Aunt
Witness the power of exponential growth with an activity that investigates two different savings plans. Class members create tables of values to see how and when a savings plan increasing exponentially exceeds one increasing linearly.
Bowland
Keeping the Pizza Hot
Learners conduct an experiment to develop a cooling curve for pizza. They consider how this affects pizza delivery in terms of packing material, distance, and delivery routes.
Curated OER
Walk-A-Thon
Students graph linear http://www.lessonplanet.com/review?id=180542equations. In this problem solving lesson, students calculate slope and plot ordered pairs on a coordinate grid. Using a real-life example of a walk-a-thon, students...


