CK-12 Foundation
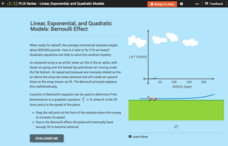
Linear, Exponential, and Quadratic Models: Bernoulli Effect
How can an object as heavy as an airplane fly? Turns out the answer is quadratic! Your classes explore the Bernoulli Effect through an interactive graph representation. As a plane increases in speed, the lift force also increases. Young...
EngageNY
Read Expressions in Which Letters Stand for Numbers II
Reading and writing take on a whole different meaning in math class. Young mathematicians learn to read verbal phrases by focusing on operation words. They write equivalent algebraic expressions for both mathematical and contextual...
Curated OER
Math in English Skills III Exercise Book: Understanding Fractions
Fractions can be tricky, and there is no better way to tackle tricky topics than with a visual representation. Intended for learners in grades two and three, this set of printable worksheets provides a variety of fractions represented in...
Mascil Project
Epidemics: Modelling with Mathematics
The Black Death epidemic is responsible for more than one million deaths in the United Kingdom. An inquiry-based activity has young scholars explore the rate of disease spread. They then analyze graphs showing data from epidemics such as...
Illustrative Mathematics
Logistic Growth Model, Abstract Version
Here learners get to flex some serious algebraic muscles through an investigation of logistic growth. The properties of the constant terms in the logistic growth formula are unraveled in a short but content-dense activity. Moving...
Kenan Fellows
Least Squares Linear Regression in R
The task? Determine the how effective hospitals are at reducing the rate of hospital-acquired infections. The method? Data analysis! Using an open source software program, individuals use provided data and create scatterplots to look for...
Radford University
Can I Create a Line/Curve of Best Fit to Model Water Drainage?
Learners collect data on the amount of water left in a bottle over time. They graph the data to determine whether the scatter plot shows a curved or straight relationship. Group members then determine an equation for the curve of best...
University of Utah
Statistics-Investigate Patterns of Association in Bivariate Data
Young mathematicians construct and analyze patterns of association in bivariate data using scatter plots and linear models. The sixth chapter of a 10-part eighth grade workbook series then prompts class members to construct and interpret...
Curated OER
Deciphering Word Problems in Order to Write Equations
Help young mathematicians crack the code of word problems with this three-lesson series on problem solving. Walking students step-by-step through the process of identifying key information, creating algebraic equations, and finally...
Benjamin Franklin High School
Saxon Math: Algebra 2 (Section 3)
In this third of a twelve-part series, the focus moves from using matrices to solving systems of equations with substitution and elimination, including more than two dimensions and variables in equations, and analyzing statistical data....
CK-12 Foundation
Comparison of Fractions, Decimals, and Percents: Filling in the Squares
An interactive equipped with five questions challenges mathematicians to convert between fractions, decimals, and percents. A diagram changes its size to visually depict conversions alongside symbols to compare them. Question types...
EngageNY
Interpreting Division of a Whole Number by a Fraction—Visual Models
Connect division with multiplication through the use of models. Groups solve problems involving the division of a whole number by a fraction using models. The groups share their methods along with the corresponding division and...
EngageNY
Modeling Linear Relationships
Math modeling is made easy with the first installment of a 16-part module that teaches pupils to model real-world situations as linear relationships. They create graphs, tables of values, and equations given verbal descriptions.
EngageNY
Linear Models
Expand your pupils' vocabulary! Learn how to use statistical vocabulary regarding linear models. The instructional activity teaches scholars the appropriate terminology for bivariate data analysis. To complete the module, individuals use...
EngageNY
The Relationship Between Visual Fraction Models and Equations
Ours is to wonder why, not just to invert and multiply. The seventh installment of a 21-part module uses fraction models to help pupils understand why the invert-and-multiply strategy for dividing fractions works. They then work on some...
Virginia Department of Education
Logarithmic Modeling
Explore logarithms and logarithmic regression. Young mathematicians first learn about inverse functions and about the logarithm function family. They take their newfound knowledge to use logarithmic functions to model situations and...
Virginia Department of Education
Linear Modeling
An inquiry-based algebra lesson explores real-world applications of linear functions. Scholars investigate four different situations that can be modeled by linear functions, identifying the rate of change, as well as the strength and...
Illustrative Mathematics
Toilet Roll
Potty humor is always a big hit with the school-age crowd, and potty algebra takes this topic to a whole new level. Here the class develops a model that connects the dimensions (radii, paper thickness, and length of paper) of a common...
101 Questions
Coins in a Circle
Round and round you'll go! Learners watch as different-sized circles fill with coins. They collect data and then make a prediction about the number of coins that will fit in a large circular rug.
CK-12 Foundation
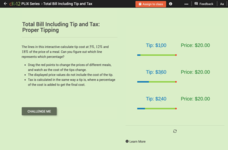
Prices Involving Sales Tax: Proper Tipping
A five-question interactive challenges mathematicians to find a correct tip and total amount using percents five, 12, and 18. A tool with moveable pieces assists participants in locating answers. Types of questions include...
EngageNY
The Power of Exponential Growth
How do you make a penny grow to $5,000 in just 15 days? Use the examples in this lesson to explore the concept of exponential growth and its comparison to linear models. Pupils come to understand that exponential growth eventually...
Curated OER
It's Not All Greek to Me
Learners find out the meaning for prefixes used in math vocabulary. By dissecting words used in everyday math, they figure out what the prefix indicates and what the word means. A variety of well-organized worksheets and activities...
University of North Texas
Math Exam 1 Review
Perfect as a review guide, this instructional activity provides a range of questions focusing on functions. Topics include composing functions, transformations, domains, and polynomials. Also included are corresponding worksheets...
Curated OER
Modeling in Algebra
In this modeling in algebra worksheet, 8th graders solve ten different types of algebra problems, including 5 word problems. They first complete each table, describe the pattern used, and determine the 20th and nth term for each....


