Curated Video
Global Maps of Dryness Help Prepare for Water Use Around Globe
Using measurements from two satellite missions assimilated into a computer model, researchers have created global maps of terrestrial water around the planet. In addition, they can forecast water availability in the United States up to...
Curated Video
Hurricane Forecasts Rely on Modeling the Past
Improving hurricane forecasts means testing historical storms with today's sophisticated models and supercomputers. NASA and NOAA work together in gathering ground and satellite observations, as well as experimenting with research...
Curated Video
A New Forecast Model Gives Scientists a Longer View of Arctic Sea Ice
Arctic sea ice extent ebbs and flows with the seasons. During the summer months, the ice melts and the edge recedes northward, usually reaching its annual minimum sometime in September. The ice extent is shaped by a variety of factors,...
National Woman's History Museum
Women's History Minute: Katherine Johnson
Launch a study of Katherine Johnson and her contributions to the NASA Space Program with a short video that introduces viewers to little-known information about the role she and other women played. The video also reveals the gender bias...
Curated OER
Nasa Count Down
A real astronaut in a space ship counts down from 10. When he reaches 10, a rocket blasts off. This would be a wonderful way to practice counting down. It's motivating!
American Institute of Physics
When Computers Wore Skirts: Katherine Johnson, Christine Darden, and the “West Computers”
Did you know that people, known as computers, performed the complex calculations that are now done by electronic computers? Three of these human computers, Katherine Johnson, Christine Darden, and Melba Roy Mouton are featured in a...
Curated OER
Functions and Statistics: International Space Station: Up to Us
Students explore how the International Space Station was built and how it provides first-hand experiences with the space program. They view the NASA engineers discussing the major components of the International Space Station, their...
Curated OER
Questioning NASA
Space science and math collide in this inquiry that investigates launching times for antacid-tablet rockets! Upper elementary or middle school learners collect data as they launch these mini rockets. They apply concepts of place value...
Curated OER
Cold, Clouds, and Snowflakes
Students explore satellite data and graphing. In this weather data analysis math and science lesson, students analyze NASA satellite data to draw conclusions about geographical areas where precipitation might have happened. Students...
Curated OER
Identifying Ozone Variations over Different Locations
Students analyze ozone data. In this atmosphere lesson, students will use a NASA resource to gather data for different regions of the Earth. Students will then create a graph for their data and answer related questions.
Curated OER
Our Solar System - Comparing Planetary Travel Distances
NASA presents a mini-unit on distances in our solar system. It incorporates scientific concepts of gravity, mass, density, and payload while your aspiring astronauts also employ mathematics skills. They calculate speed, they determine...
NASA
Lights on the International Space Station
Groups explore illumination with NASA's Lighting Environment Test Facility (LETF) as a context. Using the TI-Nspire app, groups determine the lux equation that models their simulation. They then use the lux equation to solve problems...
Curated OER
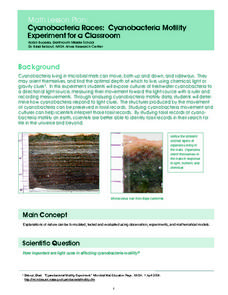
Cyanobacteria Races: Cyanobacteria Motility Experiment for a Classroom
Students experiment to determine the effect of light on cyanobacteria movement. They graph the data of the experiment for further analysis. They watch a time-lapse video of cyanobacteria motility at a NASA website.
EngageNY
Interpreting the Graph of a Function
Groups sort through NASA data provided in a graphic to create a graph using uniform units and intervals. Individuals then make connections to the increasing, decreasing, and constant intervals of the graph and relate these connections...
Curated OER
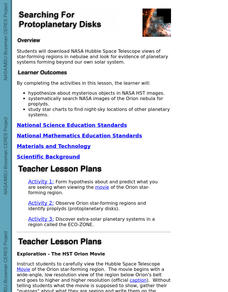
Searching For Protoplanetary Disks
Students download NASA Hubble Space Telescope views of star-forming regions in nebulae and look for evidence of planetary systems forming beyond our own solar system. They hypothesize about mysterious objects in NASA HST images.
Curated OER
From Future Flight to Past Flight
Students complete a set of CD-ROM's to introduce them to the flight program at NASA. In groups, they research a topic related to flight and put their information on a CD-ROM. To end the lesson plan, they share their material with other...
Curated OER
Explore Surface Types on a Journey Around Earth
Students explore satellite data. In this technology cross-curriculum math and world geography lesson, students locate specific map areas using a microset of satellite data. Students use technology and math skills to determine percentages...
Curated OER
Patterns, Functions, and Algebra: Wired for Space
Students assess how patterns, functions and algebra can assist NASA engineers design new ways of propelling spacecrafts. They explore how electricity and magnetism are replacing the fuel-consuming rocket propulsion. Electromagnetism is...
Curated OER
Data Analysis and Measurement: Ahead, Above the Clouds
Students explore and discuss hurricanes, and examine how meteorologists, weather officers, and NASA researchers use measurement and data analysis to predict severe weather. They plot points on coordinate map, classify hurricanes...
Curated OER
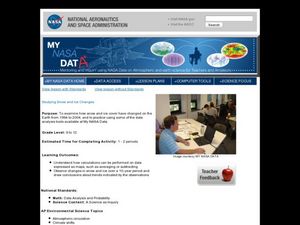
Studying Snow and Ice Changes
High schoolers compare the change in snow and ice over a 10 year period. In this environmental science lesson, students use the live data on the NASA site to study and compare the monthly snow and ice amounts on a map of the entire...
Curated OER
Doing More In Less
Students watch segments of a NASA program called "Doing More In Less". In groups, they examine the concept of human exploration and how NASA has contributed to specific research. They are introduced to new vocabulary and answer...
Curated OER
Earth From Space
Students watch a series of programs from NASA titled "Earth From Space". After viewing the program, they identify ways NASA is researching the reasons why the Earth is changing. They discuss the various levels of the atmosphere and...
Curated OER
Pitot Tube Problem Set
Students read a NASA Web-based text and use its information to complete an activity which uses a pitot tube to calculate the speed of an airplane.
Curated OER
Drag Problem Set
Students read an explanation from a NASA Web-based textbook and then demonstrate an understanding of the text by applying it to calculating drag of both full-sized and model gliders.
Other popular searches
- Nasal Passages
- About Nasa
- Nasa Planets
- Nasa Robots
- Nasa Lesson Math
- Nasa Aircraft
- Nasa Materials
- History of Nasa
- Nasa Lesson Plans
- Nasa Web Based Textbook
- Nasa Aurora
- Contributions of Nasa


