Council for Economic Education
Satisfaction Please! (Part 2)
Simply understanding consumer rights may not help people solve their problems. Understanding who to turn to becomes key in many different scenarios. Teach the value of various organizations that fight for consumer rights through...
EngageNY
Vectors in the Coordinate Plane
Examine the meaning and purpose of vectors. Use the lesson to teach your classes how find the magnitude of a vector and what it represents graphically. Your pupils will also combine vectors to find a resultant vector and interpret its...
Missouri Department of Elementary
What Are Bullying and Harassment? Part 2
After reviewing notes from the previous lessons, small groups obtain a scenario card that describes a situation in which bullying is happening. Peers discuss the event and brainstorm two solutions using the STAR method then present their...
Illustrative Mathematics
Return to Fred's Fun Factory (with 50 Cents)
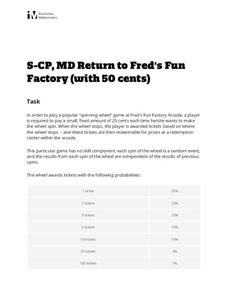
The penny arcade gets the statistics treatment in this fun probability investigation. A non-standard game of chance is described and then the class is set loose to find missing probabilities, determine common outcomes, and evaluate...
Curated OER
Wood
Students practice reading comprehension strategies. In this literacy and science lesson plan, students read a non-fiction article about wood and locate main ideas and details. Students construct a card game using information taken from...
Curated OER
Learning to Measure with Ladybug
Students practice measuring items with non standard units. In this units lesson plan, students measure shapes, lengths, and classroom objects.
Curated OER
Using Primary Sources to Discover Reconstruction
Fifth graders discover how reconstruction had an impact on racial issues in the United States. For this Reconstruction lesson, 5th graders are introduced to primary vs. secondary resources and then rotate through stations to view...
Curated OER
Printmaking Monoprints
Young scholars learn the concept of monoprint and explore different methods of making prints. They also examine how an image in print is reversed. The exploration of non-objective art is used to help students utilize principles to create...
Curated OER
Wolf Communications Matching Activity
Students complete several activities to learn about wolves. In this wolf science lesson plan, students read and complete activities to learn about wolf communication, their life cycle, fun facts, and hunting activities. Students also...
Curated OER
Prime and Composite Numbers - Kenwood Academy
Learners investigate prime and composite numbers. They use a number chart and cross out multiples of 2,3,5 etc. up to 100. Pupils fold pieces of masking tape around pennies and label them with composite numbers, then fold masking tape...
Curated OER
Your Own Fresh Water Aquarium in the Classroom
Students explore aquariums. In this fish and ecosystems lessons, students establish a freshwater aquarium environment using materials provided. Students read about and care for the classroom fish.
Curated OER
INTRODUCTION TO THE PERIODIC TABLE
Students identify the scientist who first wrote the Periodic Table, identify the scientist who amended the Table, state (or write) specific data relating to the history of the Periodic Table, identify at least five elements, and two...
Curated OER
Altimetry
Fifth graders accurately measure the distance to eight points on an uneven surface by conducting a simulation of sattelite altimetry. They create a two-dimensional model of the simulated ocean surface by graphing data from the Radar Run...


