American Statistical Association
Nonlinear Modeling: Something Fishy
There are plenty of fish in the sea, but only a few good resources on regression. Young mathematicians first perform a linear regression analysis on provided weight and length data for fish. After determining that a linear model is not...
Curated OER
Linear and Quadratic Model, Data Modeling
Students model quadratic and linear equations. In this algebra lesson, students solve word problems using equations. They create scatter plots and make predictions using correlations.
Curated OER
Linear and Exponential Models
Students linearize data to determine if an exponential model is suitable. In this linearizing data to determine if an exponential model is suitable instructional activity, students graph the residuals of sets of data that appear to have...
Curated OER
Linear and Exponential Models
Students investigate the differences between linear and exponential models. In this linear and exponential models lesson, students make a table of given data. Students determine if the data is linear or exponential by plotting the data...
PBL Pathways
Students and Teachers 2
Examine trends in student-to-teacher ratios over time. Building from the first task in the two-part series, classes now explore the pattern of student-to-teacher ratios using a non-linear function. After trying to connect the pattern to...
Curated OER
Walk the Line
Learners create constant speed versus motion graphs. They will perform linear regressions on their data to describe the graphs mathematically.
Curated OER
Line of Best Fit
Students explore the concept of linear regression. In this linear regression lesson, students do a Barbie bungee activity where they collect linear data. Students plot their data using a scatter plot. Students determine a line of best...
Curated OER
Make a Pass at Me
Students identify different types of functions and units of measurements. In this statistics lesson plan, students will collect data, graph their data and make predictions about their data. They plot a linear regression graph.
Beyond Benign
Water Bottle Unit
How much plastic do manufacturers use to create water bottles each year? The class explores the number of water bottles used throughout the years to determine how many consumers will use in the future. Class members compare different...
Teach Engineering
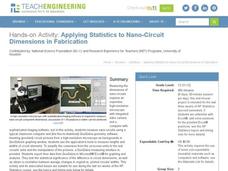
Applying Statistics to Nano-Circuit Dimensions in Fabrication
Do flexible circuits change dimensions during fabrication? Groups use GeoGebra software to measure the length of pictures of flexible nano-circuits. To determine if the circuits change dimensions, future engineers use Microsoft Excel to...
Wake Forest University
Authentic Activities for Connecting Mathematics to the Real World
Check out the handout from a presentation that contains a collection of high school algebra projects connecting a variety of mathematics to the real world. Activities range from simple probabilities to calculus. The activities can be...
Curated OER
Numerical Analysis: Introduction to Approximation Theory
In this introduction to approximation theory, students compute the slope and intercept of a line. They describe nonlinear relationships. This four page worksheet contains approximately five problems.
Curated OER
Topic 2: Graphing 2-Variable Linear Equations
Young scholars explore the concept of 2-variable equations and expressions. In this 2-variable equation and expression lesson, students translate 2-variable word problems into 2-variable equations and expressions.
EngageNY
Graphs of Quadratic Functions
How high is too high for a belly flop? Learners analyze data to model the world record belly flop using a quadratic equation. They create a graph and analyze the key features and apply them to the context of the video.
Texas Instruments
Let's Play Ball with Families of Graphs
Learners explore quadratic equations in this Algebra II instructional activity. They investigate families of quadratic functions by graphing the parent function and family members on the same graph. Additionally, they write the equation...
Curated OER
Logarithmic Transformations of Data
Students investigate and study logarithmic equations. In this precalculus lesson plan, students analyze the data behind the function. They define each graph as positive, negative or no correlation. They find the line of best fit.
Curated OER
Algebra I Project: Make Your Own Business
Students explore the concept of algebra in real world situations. For this economics lesson, students design, plan, run, and evaluate a small business. Students will create a product, market the product, and try to make a profit.
Curated OER
Topic 5: Running the Business
Students explore the concept of running a business. In this running a business lesson, students put their plan of action into practice. Students market a product and try to maximize profit.
Curated OER
Topic 6: Evaluating and Presenting Results
Students construct spreadsheets from raw data. For this spreadsheet construction lesson, students compile data into Microsoft Excel. Students familiarize themselves with entering and presenting data in a spreadsheet.


