Curated OER
Word Problems Mixture, Distance, Money and Integer
In this word problem activity, students read mixture, distance, money, and integer problems. They write algebraic equations and solve them. This one-page activity contains 32 multi-step problems. Answers are provided at...
Curated OER
Graphs
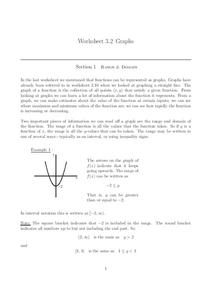
In this graphs worksheet, students solve and complete 15 various types of problems. First, they determine the range of the function of the graph shown and write in interval notation. Then, students find the domain of the function in the...
Curated OER
Fall 2005 Midterm Exam #1
You've got the power! With this physics midterm, you have the power to assess learners' grasp of electricity concepts. The exam is neatly formatted and provides a variety of question types: true or false, multiple choice, and problem...
Curated OER
Simultaneous Equations for Circuit Analysis
For this worksheet, students use Algebra to plot different solutions to equations and analyze schematics in order to answer a series of 25 open-ended questions about electrical circuits. This worksheet is printable and the answers are...
Curated OER
Finding out about Gallery 33
While these worksheets are specific for use while visiting the Birmingham Museum and Art Gallery, they could be used to guide nearly any museum trip. Questions focus on human activity, symbolism, culture, religion, and society as...
EngageNY
Solutions of a Linear Equation
Use the distributive property to solve equations. The sixth lesson in a 33-part series has scholars solve equations that need to be transformed into simpler equations first. Class members apply the distributive property to the equations...
Lane Community College
Review Sheets: Basic Mathematics 2
A good mix of Pre-Algebra problems, learners tackle everything from proportions and equations, to polygons and circles. The sections are broken up by topic with a list of the skills that are required to complete the questions.
Centre for Innovation in Mathematics Teaching
Ten Data Analysis Activities
This thirteen page data analysis worksheet contains a number of interesting problems regarding statistics. The activities cover the concepts of average measurements, standard deviation, box and whisker plots, quartiles, frequency...
Willow Tree
Box-and-Whisker Plots
Whiskers are not just for cats! Pupils create box-and-whisker plots from given data sets. They analyze the data using the graphs as their guide.
EngageNY
Percent Error Problems
Individuals measure a computer monitor and determine how accurate their measures are. The eighth segment in a series of 20 introduces the concept of percent error. Pupils find the percent error of their measurements and discuss the...
Willow Tree
Mean, Median, and Mode
Statistics are more than just numbers—they can give you important information about a set of data. Pupils learn how to find the mean, median, and mode of a data set. They also find the next score to reach a desired mean.
Curated OER
Weighted Averages
Weighted averages can be tricky to explain! However, this study guide makes it easy for teachers by including definitions, explanations, and breaking down problems into three steps. Includes mixture problems and uniform motion problems.
Virginia Department of Education
Analyzing and Interpreting Statistics
Use measures of variance to compare and analyze data sets. Pupils match histograms of data sets to their respective statistical measures. They then use calculated statistics to further analyze groups of data and use the results to make...
EngageNY
Describing the Center of a Distribution Using the Median
Find the point that splits the data. The lesson presents to scholars the definition of the median through a teacher-led discussion. The pupils use data lists and dot plots to determine the median in sets with even and odd number of data...
Raytheon
Adding and Subtracting Decimals
For this adding and subtracting decimals instructional activity, students add and subtract numbers with decimals in word problems. Students complete 12 word problems.
EngageNY
Part of a Whole as a Percent
Pupils use visual models, numeric methods, and equations to solve percent problems. To complete the second installment of 20, they find the part given the percent and the whole, find the percent given the part and the whole, and find the...
Curated OER
Mean, Median and Mode (II)
In this mean worksheet, students examine given information and determine the mean, mode and median of data. This one-page worksheet contains 10 problems. Answers are provided.
Curated OER
Systems of Equations and Inequalities
This is a comprehensive lesson on creating and solving equations and systems of equations and inequalities. Problems range from basic linear equations to more complex systems of equations and inequalities based on a real-world examples....
EngageNY
Estimating Centers and Interpreting the Mean as a Balance Point
How do you balance a set of data? Using a ruler and some coins, learners determine whether the balance point is always in the middle. Through class and small group discussions, they find that the mean is the the best estimate of the...
Charleston School District
Solving Equations with Infinite or No Solutions
Where did all the variables go? Scholars learn how to interpret an equation when they eliminate all variables during the solving process. They interpret the solution as infinite solutions or no solutions.
Willow Tree
Circle Graphs
Pie isn't just for eating! Scholars learn to create pie charts and circle graphs to represent data. Given raw data, learners determine the percent of the whole for each category and then figure out the degree of the circle that percent...
EngageNY
Writing and Interpreting Inequality Statements Involving Rational Numbers
Statements often have multiple interpretations — but not these inequality statements. Scholars compare rational numbers and write inequality statements symbolically. The lesson includes problems that require comparing three numbers.
West Contra Costa Unified School District
Average Rate of Change
Learners investigate average rates of change for linear functions and connect the concept to slope. They then determine average rates of change in quadratic and exponential functions.
West Contra Costa Unified School District
Derivative – Standard Definition
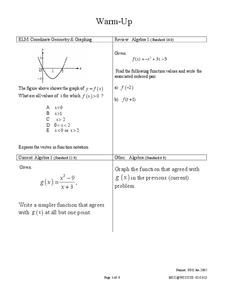
Making a clear connection to algebra concepts helps learners understand the definition of a derivative. The lesson plan begins with looking at limits of simple linear and rational functions, and leads to the definition of...
Other popular searches
- Music Note Values
- Beginning Music Note Values
- Musical Note Values
- Rhythm & Note Values
- Teaching Note Values
- Note Values in Music
- Learning Note Values
- Note Values Worksheet
- Sixteenth Note Values
- Reading Music Note Values
- Note Values and Rhythm
- Dotted Note Values


