EngageNY
Writing and Evaluating Expressions—Multiplication and Division
Don't table the resource on writing expressions for relationships in tables. Scholars investigate relationships between variables and write algebraic expressions involving multiplication and division. These expressions help solve...
EngageNY
Describing a Distribution Displayed in a Histogram
The shape of the histogram is also relative. Learners calculate relative frequencies from frequency tables and create relative frequency histograms. The scholars compare the histograms made from frequencies to those made from relative...
Curated OER
Laws of Exponents
In this exponent worksheet, students simplify expressions containing exponents. They use the laws of exponents to multiply and divide positive and negative exponents with variables. This two-page worksheet contains 24 problems. Answers...
Curated OER
Take-Home Midterm Exam #3, Part A
Let your physics learners take this electromagnetic radiation exam home to show what they know. You could also use it in class or assign it as a review. The content covers concepts pertaining to color, wavelength, frequency,...
Illustrative Mathematics
Running a Mile
The single question in this activity has multiple ways to be solved. Two boys ran a mile. Their times were similar, except one time was a fraction of the other. Who ran faster? In demonstrating the answer to this problem, upper graders...
Houston Area Calculus Teachers
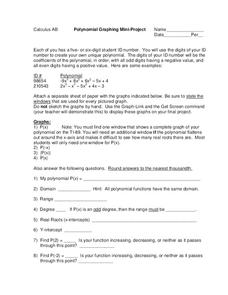
Polynomial Graphing
Your AP Calculus learners probably have their ID numbers memorized, but have they tried graphing them? Pique your pupils' interest by asking each to create a unique polynomial function based on their ID numbers, and then analyze the...
Gatsby Charitable Foundation
Four Activities Using Straight Line Graphs
This math packet includes four different activities which puts linear equations and line of best fit in the context of real world applications. Each activity uses a different linear math modeling equation and asks the learners to...
Curated OER
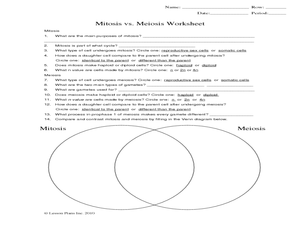
Mitosis vs. Meiosis Worksheet
This complete worksheet includes short answer and multiple choice questions as well as a Venn diagram for comparing and contrasting mitosis with meiosis. Separate teachers' instructions are supplied. This could be used as homework and is...
Teach Engineering
Can You Resist This?
Some things are hard to resist. Small collaborative groups build circuits and calculate the voltage using Ohm's Law. Budding engineers explore the connection between the voltage across different resistors and linear...
EngageNY
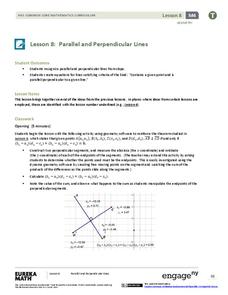
Parallel and Perpendicular Lines
Use what you know about parallel and perpendicular lines to write equations! Learners take an equation of a line and write an equation of a line that is parallel or perpendicular using slope criteria. They then solve problems to...
EngageNY
Summarizing a Distribution Using a Box Plot
Place the data in a box. Pupils experiment with placing dividers within a data set and discover a need for a systematic method to group the data. The 14th lesson in a series of 22 outlines the procedure for making a box plot based...
IREM
Conflict Management Styles Assessment
How do you prefer to handle conflict? And what does your approach say about you? Although not a validated, or scientific instrument, this assessment is sure to generate lively discussion.
Minnesota Literacy Council
Scientific Method
Here is a resource with a descriptive approach to explaining the scientific method. It's simple, but effective for both introduction and reinforcement of this concept.
University of Notre Dame
The Natural Exponential Function
Ready to apply the concepts related to the natural exponential equations and logarithmic equations? A math lesson reviews concepts from inverse properties to solving to derivatives and integrals.
West Contra Costa Unified School District
Correlation and Line of Best Fit
Computers are useful for more than just surfing the Internet. Pupils first investigate scatter plots and estimate correlation coefficients. Next, they use Microsoft Excel to create scatter plots and determine correlation...
Federal Reserve Bank
Saving and Investing for the Long Term
Create savvy investors with an activity that uses an online resource to allow individuals to invest in the stock market. The teacher is able to track activity and progress. Stock tips and strategies are shared.
Illustrative Mathematics
Foxes and Rabbits 2
The fox population chases the rabbit population. Groups model the populations of foxes and rabbits with two trigonometric functions. Individuals graph both trigonometric models on the same graph, and then teams determine an explanation...
Curated OER
Academic Grade 9 Assessment of Mathematics: Algebra I and Geometry
Test your class, or use this 12 page math packet as chapter review. They solve 21 multiple choice problems which require them to graph linear equations, find the volume of prisms and cones, find unknown angles, and determine...
Curated OER
Mapping Worksheet #1
Get out the compass and a pencil its time to use a coordinate grid to practice mapping skills. Young cartographers use the prompts and provided grid to plot locations, draw parallel lines, and determine distances between points.
Curated OER
Unit VIII: Worksheet 2 - Centripetal Force
Circular motion can make you loopy! On this physics worksheet, learners practice solving problems regarding centripetal force, rotational period, speed, acceleration, and more. A flying aerobat and a couple of amusement park rides make...
Library of Congress
Determining Point of View: Paul Revere and the Boston Massacre
If you're teaching point of view, this is the lesson for you! First, decipher the writer's point of view from a primary resource, then compare and contrast the primary source with a secondary source to explore the Paul Revere's...
EngageNY
More on Modeling Relationships with a Line
How do you create a residual plot? Work as a class and in small groups through the activity in order to learn how to build a residual plot. The activity builds upon previous learning on calculating residuals and serves as a...
EngageNY
What Is Area?
What if I can no longer justify area by counting squares? Lead a class discussion to find the area of a rectangular region with irrational side lengths. The class continues on with the idea of lower approximations and...
EngageNY
The Scaling Principle for Area
As they investigate scaling figures and calculate the resulting areas, groups determine the area of similar figures. They continue to investigate the results when the vertical and horizontal scales are not equal.
Other popular searches
- Music Note Values
- Beginning Music Note Values
- Musical Note Values
- Rhythm & Note Values
- Teaching Note Values
- Note Values in Music
- Learning Note Values
- Note Values Worksheet
- Sixteenth Note Values
- Reading Music Note Values
- Note Values and Rhythm
- Dotted Note Values


