Curated OER
Unit 3: Scientific Writing
Write-on! Demonstrate a writing model and support learners as they write an informational essay on a water resource issue of your (or their) choosing. The lesson plan provides a well-scaffolded summative writing...
Curated OER
Comparing Fractions
Young mathematicians compare two fractions with like denominators and then move to the next level to compare fractions with unlike denominators. They will first try to use mental math to make educated guesses. There are a few guidelines...
Curated OER
Things in a Line
Little learners recognize symbols, objects and how to depict numbers. In this matching lesson, they can match the number names with a set of items, model ordinal numbers, and complete a cute, cartoon-character worksheet.
Achieve
BMI Calculations
Obesity is a worldwide concern. Using survey results, learners compare local BMI statistics to celebrity BMI statistics. Scholars create box plots of the data, make observations about the shape and spread of the data, and examine the...
American Statistical Association
How Tall and How Many?
Is there a relationship between height and the number of siblings? Classmates collect data on their heights and numbers of brothers and sisters. They apply statistical methods to determine if such a relationship exists.
DiscoverE
Nanosolutions
There are a billion reasons to use the resource! Well, not quite. A demonstration using food color and water shows scholars the meaning of nano. An iterative process results in diluting the concentration of food coloring by one tenth...
Institute for Humane Education
I've Been Branded!
How many pairs of Nikes® or Apple® products are in the average American home? What makes someone buy one particular type of laundry detergent over another? Scholars grapple with these questions as they develop a list of brands they use...
Curated OER
The Magic School Bus Goes Upstream
Students learn along with Ms. Frizzle's class. In this Magic School Bus lesson plan, students travel upstream to discover how, like salmon, a homey smell can lead them, too.
Curated OER
The Magic School Bus Makes a Stink
Students learn along with Ms. Frizzle's class. In this Magic School Bus lesson plan, students discover the secret to what makes things smell through their own investigations.
Curated OER
Activity Plan 5-6: Bugs, Bugs, Bugs!
Learners become entomologists for a day. In this life science lesson plan, students go on an insect hunt and investigate insects and their homes. This leads to the creation of an insect by each student. Lesson includes a take-home...
Curated OER
Apple Addition - To Sums of 10
In this addition worksheet, students add columns of one-digit numerals. They write their answer in the apple provided below the addition equation. There are 25 problems on a page and four pages are provided. Sums are not greater than 10....
Curated OER
Calendar Counting
Students demonstrate how to count by 2's. In this number sense lesson, students review skip counting on the hundreds chart and recognize the pattern of counting by 2's. Students use a reproducible of a calendar to color in the days as...
Curated OER
Expanded, Standard and Written Forms
Students explore expanded, standard, and written forms of numbers. In this number sense lesson, students examine the various ways of writing numbers as they complete a Venn diagram activity.
Curated OER
Patterns, Relations, and Functions
Learners investigate the patterns of different data sets of numbers. They use critical thinking skills in order to find the missing numbers in any given set. This instructional activity helps to develop the skill of number sense.
Curated OER
Estimating Solutions to Word Problems
Fourth graders explore number sense by completing word problems in class. In this estimation activity, 4th graders define terms such as sum, difference, estimate and best. Students complete estimating worksheets based on the concept of...
Curated OER
Can You Tell By Touch?
Students feel inside a bag and use only their sense of touch to describe and identify one of the objects that is inside the bag.
American Chemical Society
Natural Resources and Synthetic Materials
All synthetic materials began as natural materials. An engaging lesson begins with a hands-on activity and an example of the type of research that scholars perform independently. Then pupils receive a topic and begin researching the...
Inside Mathematics
Snakes
Get a line on the snakes. The assessment task requires the class to determine the species of unknown snakes based upon collected data. Individuals analyze two scatter plots and determine the most likely species for five...
Noyce Foundation
Ducklings
The class gets their mean and median all in a row with an assessment task that uses a population of ducklings to work with data displays and measures of central tendency. Pupils create a frequency chart and calculate the mean and median....
Curated OER
In Touch with Apples
Students read "How To Make an Apple Pie and See the World", the story of a girl who traveled the world to find the ingredients to make her apple pie. They conduct a series of interdisciplinary activities including testing their senses,...
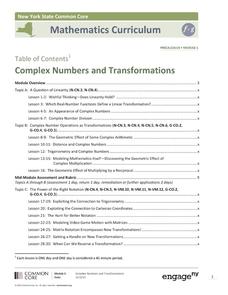
EngageNY
Complex Numbers and Transformations
Your learners combine their knowledge of real and imaginary numbers and matrices in an activity containing thirty lessons, two assessments (mid-module and end module), and their corresponding rubrics. Centered on complex numbers and...
Inside Mathematics
Picking Apples
Getting the best pick of the apples depends on where to pick. The short assessment presents a situation in which class members must analyze a real-world situation to determine the cost of picking apples. The pricing structures resemble...
Noyce Foundation
Photographs
Scaling needs to be picture perfect. Pupils use proportional reasoning to find the missing dimension of a photo. Class members determine the sizes of paper needed for two configurations of pictures in the short assessment task.
EngageNY
The Mean as a Balance Point
It's a balancing act! Pupils balance pennies on a ruler to create a physical representation of a dot plot. The scholars then find the distances of the data points from the balance point, the mean.


